Creating a Dashboard and Adding a Data Source
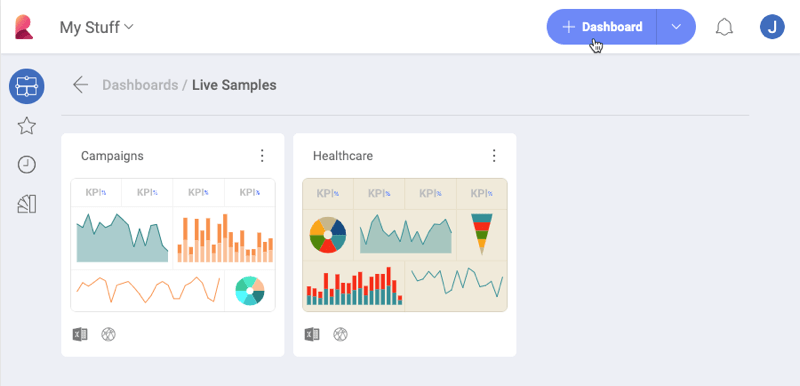
In order to create a new dashboard, you need to select the + New button in the top right-hand corner of the initial view, and select the Dashboard option in the Create New menu.
Adding a Data Source
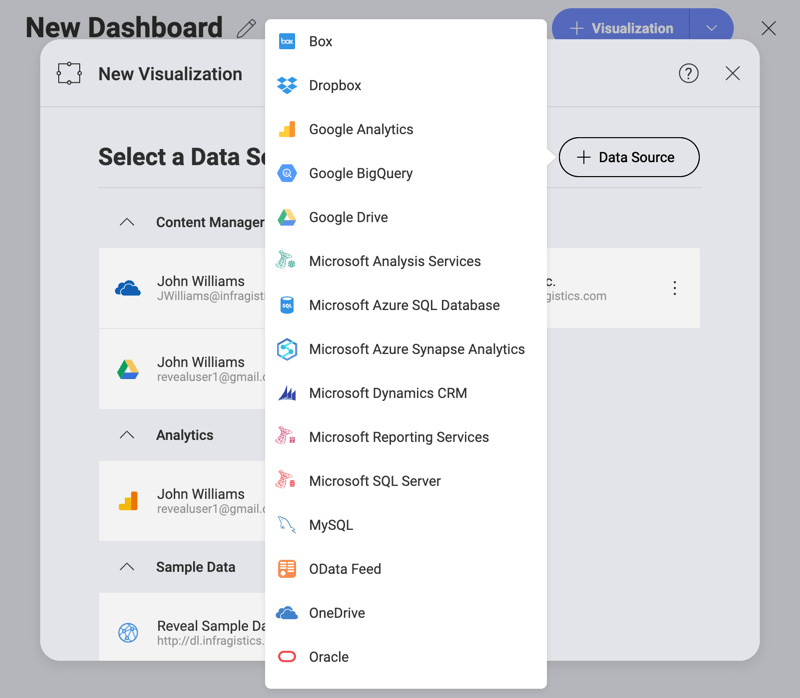
After you select Dashboard, you will see the New Visualization screen pop up. Select the + sign in the top right corner, and then the data source in which you stored the the sample datasheet mentioned in this section.
Note
For instructions on how to add a data source for each of the providers, refer to this topic.
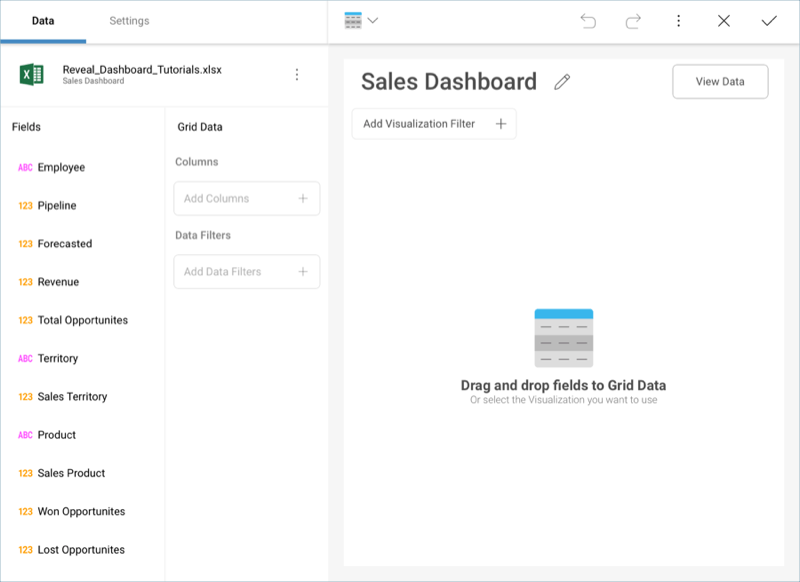
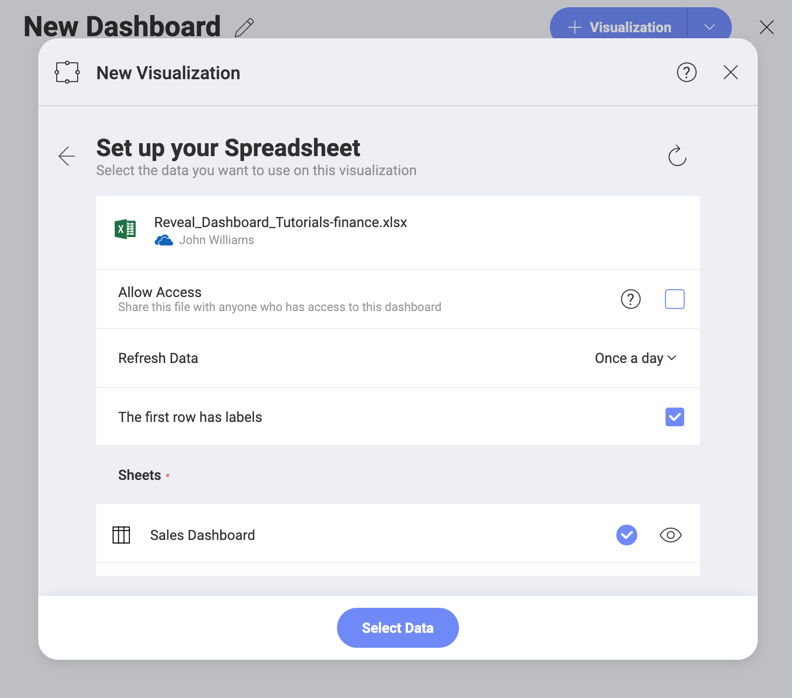
When selecting the file in the Visualization Data dialog, make sure you select the Sales Dashboard sheet of the sample spreadsheet. Then, select Load Data.
After loading your data, the Grid Chart will be selected by default in the Visualizations Editor.