Icon
Icon
  • Try it now
    Components List
    • Slingshot AI
    • Slingshot AI Overview
    • Extract Action Items
    • Summarization
    • GETTING STARTED
    • Welcome to Slingshot
    • Getting Started with Slingshot
    • FEATURES
    • Workspaces
    • Overviews
    • Tasks
      • Custom Fields
        • Types of Custom Fields
      • Task Types
      • Using Custom Fields and Task Types
    • Pins
    • Data Catalog
      • Certifications
      • Data Sources Advanced Information
    • My Analytics
      • Overview
      • Dashboards
      • Overview
      • Creating Dashboards
      • Uploading Dashboards
      • Interacting with Dashboards
      • Managing Your Dashboards
      • Styling Dashboards
      • Linking Dashboards
      • Sharing Dashboards
        • How to share a Dashboard
        • Sharing Dashboards with Cloud Files as a Data Source
        • Requesting Access to Shared Dashboards with Cloud Files
      • Exporting Dashboards
        • How to Export a Dashboard
        • Export PDF
        • Export Image
        • Export PowerPoint
        • Export Excel
      • Data Sources
      • Overview
      • Supported Data Sources
        • Amazon Athena
        • Amazon Redshift
        • Box
        • Dropbox
        • Facebook
        • Google Ads
        • Google Analytics
        • Google Analytics 4
        • Google BigQuery
        • Google Drive
        • Google Search Console
        • Hubspot
        • Instagram
        • LinkedIn
        • Marketo
        • Microsoft Analysis Services
        • Microsoft Azure Analysis Services
        • Microsoft Azure Synapse Analytics
        • Microsoft Azure SQL
        • Microsoft Dynamics CRM
        • Microsoft Reporting Services
        • Microsoft SQL Server
        • MySQL
        • OData Feed
        • OneDrive
        • Oracle
        • PostgreSQL
        • QuickBooks
        • REST API
        • Salesforce
        • SharePoint
        • Snowflake
        • Sybase
        • Web Resource
      • Managing Your Data Source Credentials
      • Changing the Data Source for a Visualization
      • Combining Data Sources in One Visualization
      • Connecting a Dashboard to Its Data Source
      • OAuth 2 / OIDC User Authentication
      • Processing Data on Server
      • Machine Learning Integration
        • Integrating with Azure ML Models
        • Integrating with BigQuery ML Models
      • Working with Files
        • Using JSON files
        • Using Spreadsheets
      • Data Visualizations
      • Overview
      • Working with the Visualization Editor
      • Visualization Types
        • Category Charts
        • Choropleth Maps
          • Overview
          • Location Data
          • Working with Choropleth Map Settings
        • Combo Charts
        • Financial Charts
        • Gauge Charts
        • Grid Chart
        • Image Chart
        • KPI Gauge
        • Pivot Table
        • Radial Charts
        • Scatter and Bubble Charts
        • Scatter Map
          • Overview
          • Using Map Image Tiles
        • Sparkline Charts
        • Text Box
        • Text View
        • Time Series Charts
        • Treemap Charts
      • Fields
        • Overview
        • Field Settings
        • Sort by Field
        • Ad-Hoc Hierarchies
        • Conditional Formatting
        • Calculated Fields
          • Overview
          • Aggregation
          • Date
          • Information
          • Logic
          • Lookup & Reference
          • Math
          • String
          • Samples, Tips, and Useful Cases
      • Reusing Visualizations
      • Statistical Functions
      • Custom Visualizations
        • How to Create a Custom Visualization
      • Filters
      • Overview
      • Dashboard Filters
      • Dashboard Filters Properties
      • Connecting Dashboard Filters to a Visualization
      • Field Filters and Rules
      • Date Range Filter
      • Visualization Filters
      • Visualization Tutorials
      • Overview
      • Candlestick Visualizations
      • Gauge Charts
      • Image Charts
      • KPI Gauge
      • OHLC Charts
      • Simple Series Charts
      • Sparkline Charts
      • Stacked Charts
      • Text View
      • Additional Resources
      • Known Issues
    • Communication
      • Discussions
      • Chat
    • Groups
    • Onboarding
    • Invite Friends
    • Search
    • Bookmarks
    • Productivity Tips
    • Archives
    • Data Limits
    • Open in New Window
    • Productivity Boost
    • SETTINGS
    • Feedback
    • User Account & Settings
      • User Account FAQ
    • Security & Privacy
    • Notifications
    • Subscriptions
    • Slingshot Enterprise Subscription
    • Slingshot Subscription
    • Templates
    • Dashboard Templates
    • Project Templates
    • Task Templates
    • Workspace Templates
    • RELEASE INFORMATION
    • Release Notes

    Dashboard Tutorials

    Within this section, you will find step-by-step tutorials on how to create a variety of Analytics dashboards. For specific information on any visualization, visit the Data Visualizations section. You can also find detailed information on which filters you can apply to a visualization or dashboard in the Filters topic.

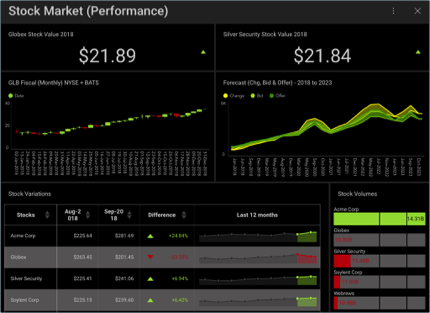
    ThumbnailFinanceDashboard All

    Finance Dashboard

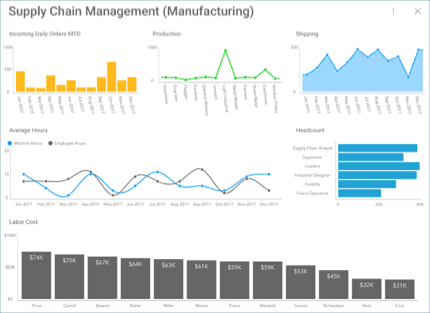
    ThumbnailManufacturingDashboard All

    Manufacturing Dashboard

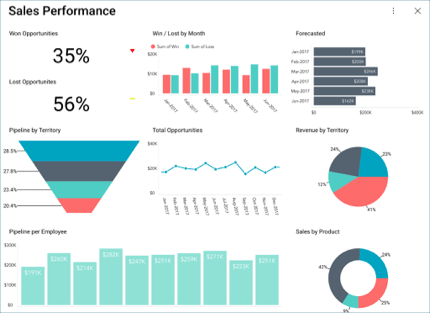
    ThumbnailSalesDashboard All

    Sales Dashboard

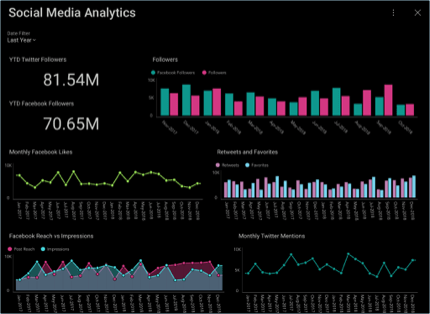
    ThumbnailSocialDashboard All

    Social Dashboard

    Slingshot Badge
    Products
    • Why Slingshot?
    • Working with Google
    • Working with Office
    Solutions
    • Marketing
    • Human Resources
    Downloads
    • Web
    • iOS
    • MacOS
    • Desktop
    • Android
    About Us
    • About Us
    • Contact Us
    • Privacy Policy
    • Cookies
    • Terms of Use
    Slingshot on iOS App Store Slingshot on Mac OS App Store Slingshot on Android's Google Play Store

    © Copyright 2021 INFRAGISTICS. All Rights Reserved. Slingshot and the Slingshot logo are registered trademarks of Infragistics Inc.