Filters
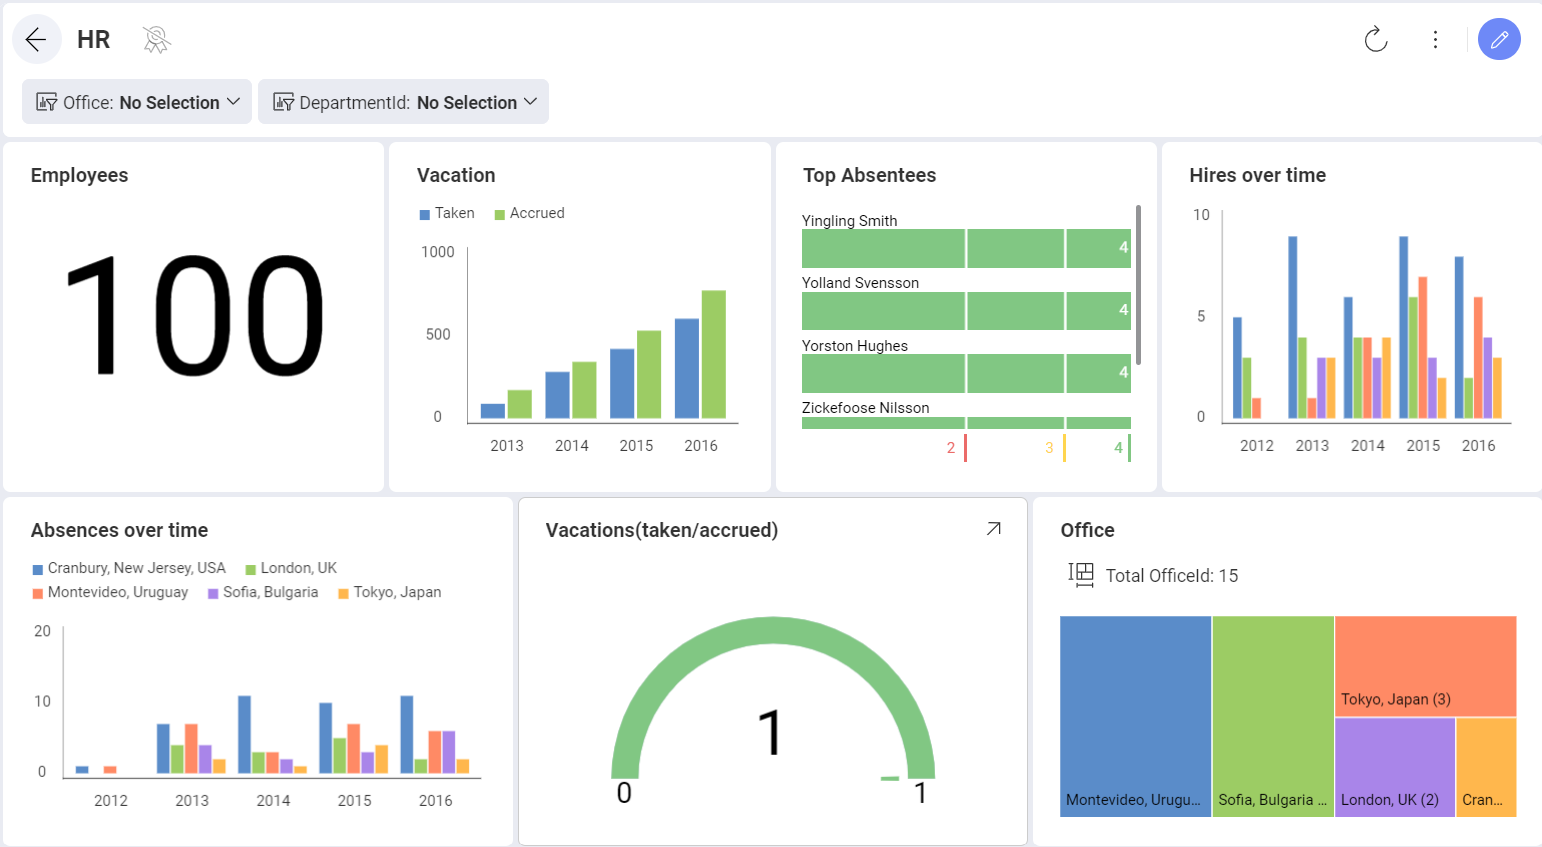
Dashboard filters allow you to slice the contents of visualizations in a dashboard all at once. When you add datasets to the dashboard filters collection, they will remain in context for all dashboard visualization to be bound to. Dynamic filtering applies to all connected visualizations, as the filter selection changes.
For instance, a dataset with the list of locations around the world can be added to enable binding all visualizations of a dashboard. In this scenario, the contents of each visualization can be filtered by location by the user browsing the information in that dashboard.
Analytics also supports activating a Date Range as a Dashboard Filter, which enables the filtering of all visualizations by a specific period of time.
The following sections will cover:
Dashboard Filters in both the Dashboard and the Visualization editor
Dashboard Filter configurable properties, including:
Dashboard Filters and their connections to visualizations, also referred to as visualization binding