Dashboard Filters and Their Properties
Accessing Dashboard Filter Properties
In order to add a new dashboard filter:
Go to the Dashboard Editor and select Add Filter.
Click/tap on Add Dashboard Filter.

Choose a data source.
The Dashboard Filter menu will open. Here you can switch to another data source and select dataset to use as a dashboard.
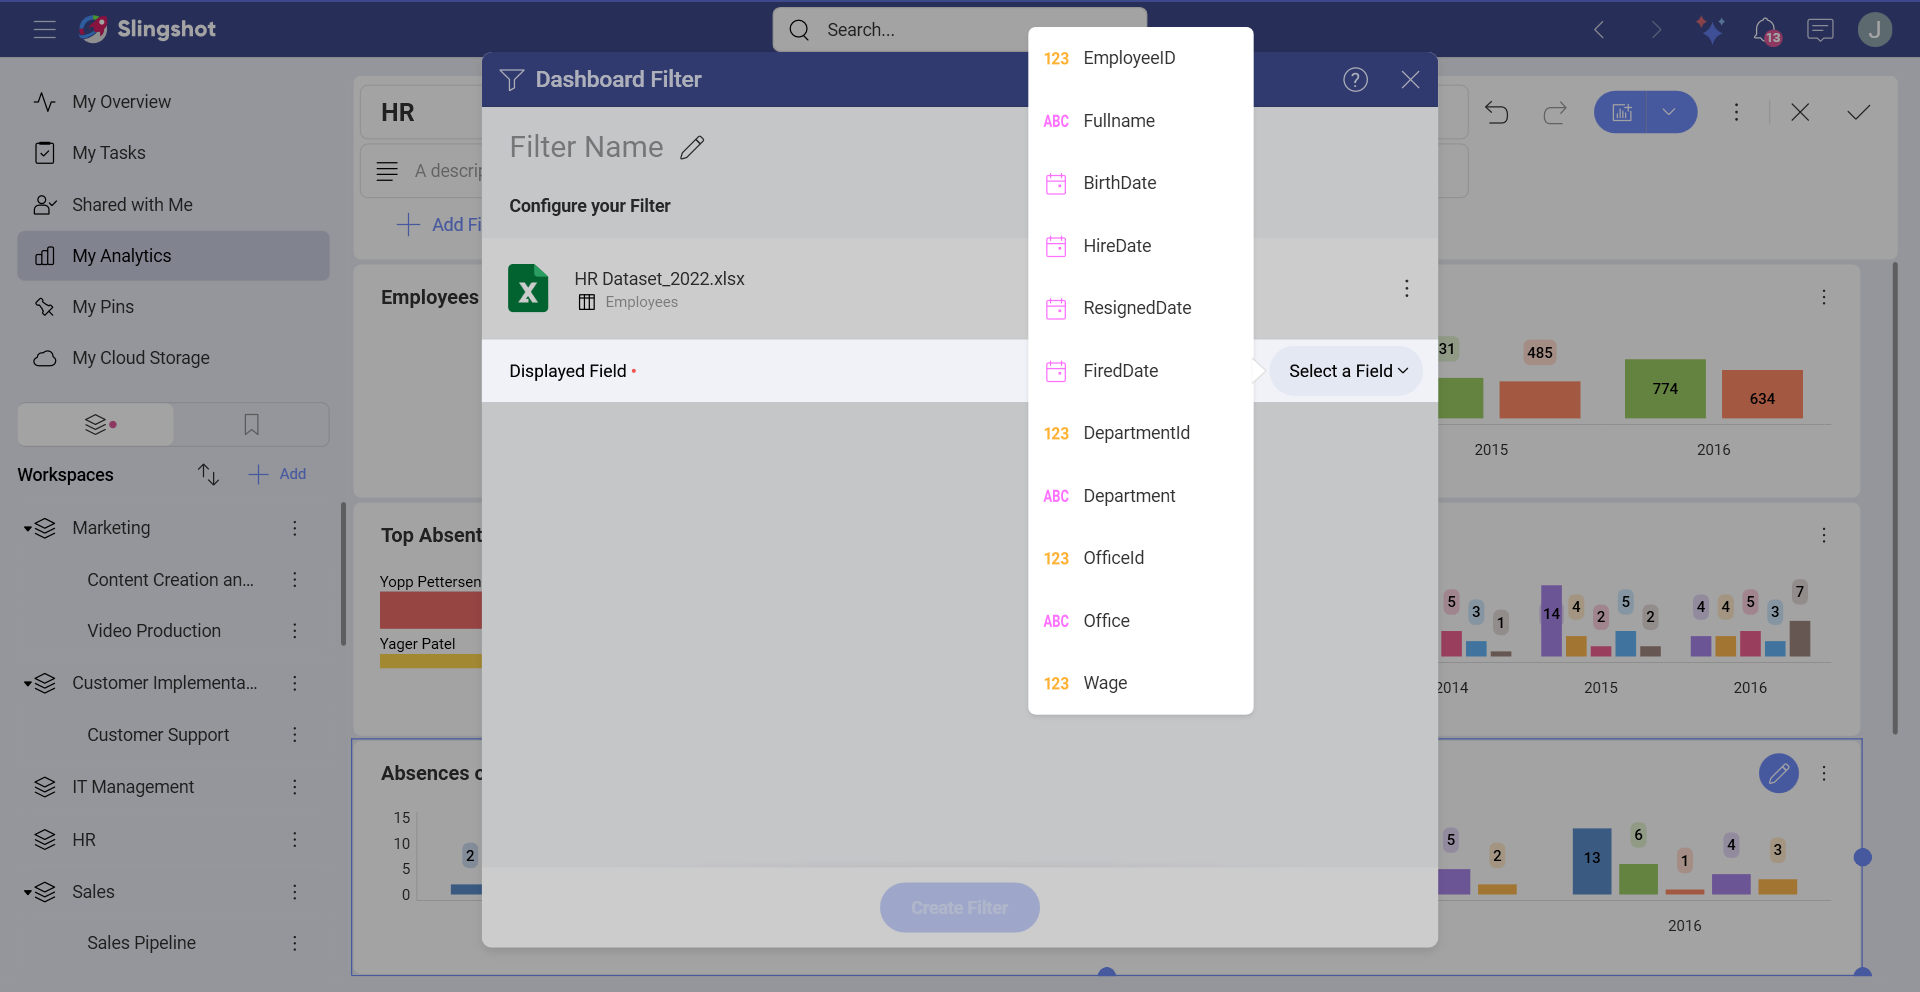
- Once you have selected a field, click/tap on Create Filter.
Filter Settings Overview
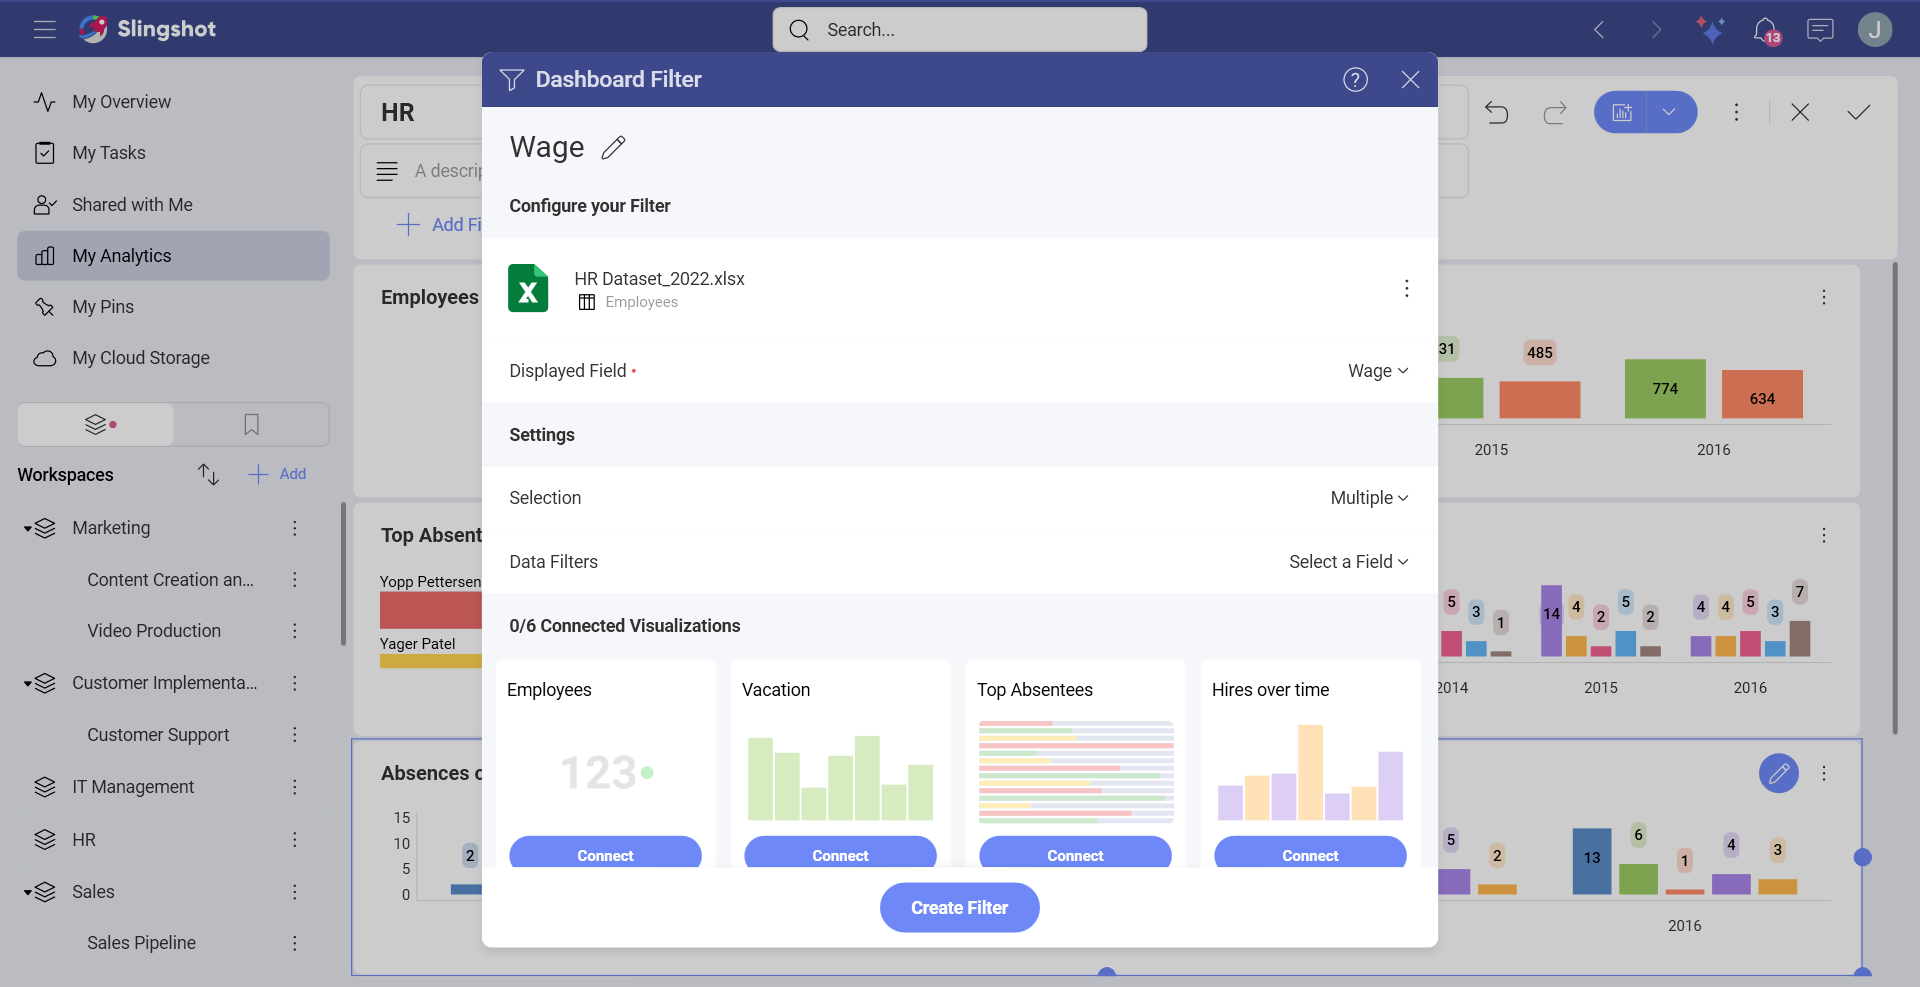
You will be able to change the following settings for the filter:
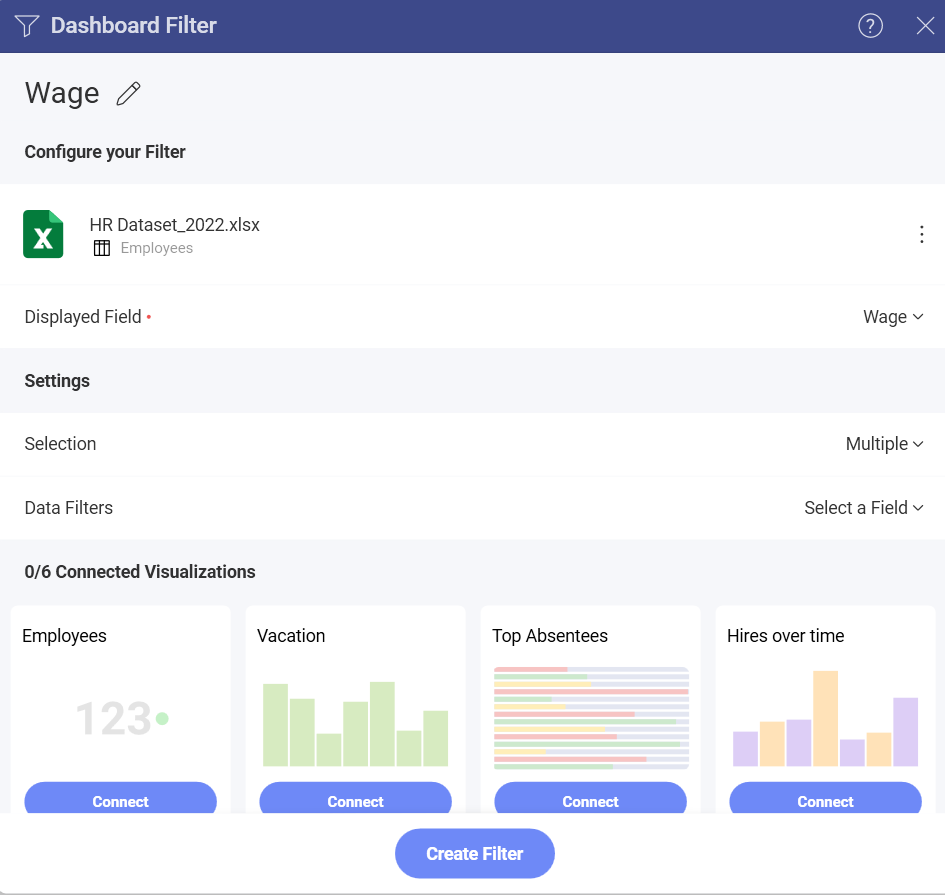
Title. The title for the dashboard filter, which will be displayed right under the dashboard title. By default, this is the name of the field that will be used as a filter.
Displayed Field/Element. The field in your dataset, which will be used as a dashboard filter.
Selection. This setting allows you to configure: Multiple Selection (more than one value can be selected at a time) and/or Required Selection (at least one value must always be selected).
Data Filters. This setting allows you to apply any field filters and rules to the data source used for the dashboard filter.
Connected Visualizations. Whether your dashboard will be connected to any visualization or not.
Displayed Field
[!NOTE] For dashboard filters using data from Microsoft Analysis Services and Google Analytics, this setting is named Displayed Element.
The Displayed Field/Element setting specifies the dataset field that will be used to display the values in the Dashboard Filters. Listed values will not be repeated even if they appear multiple times in the original dataset.
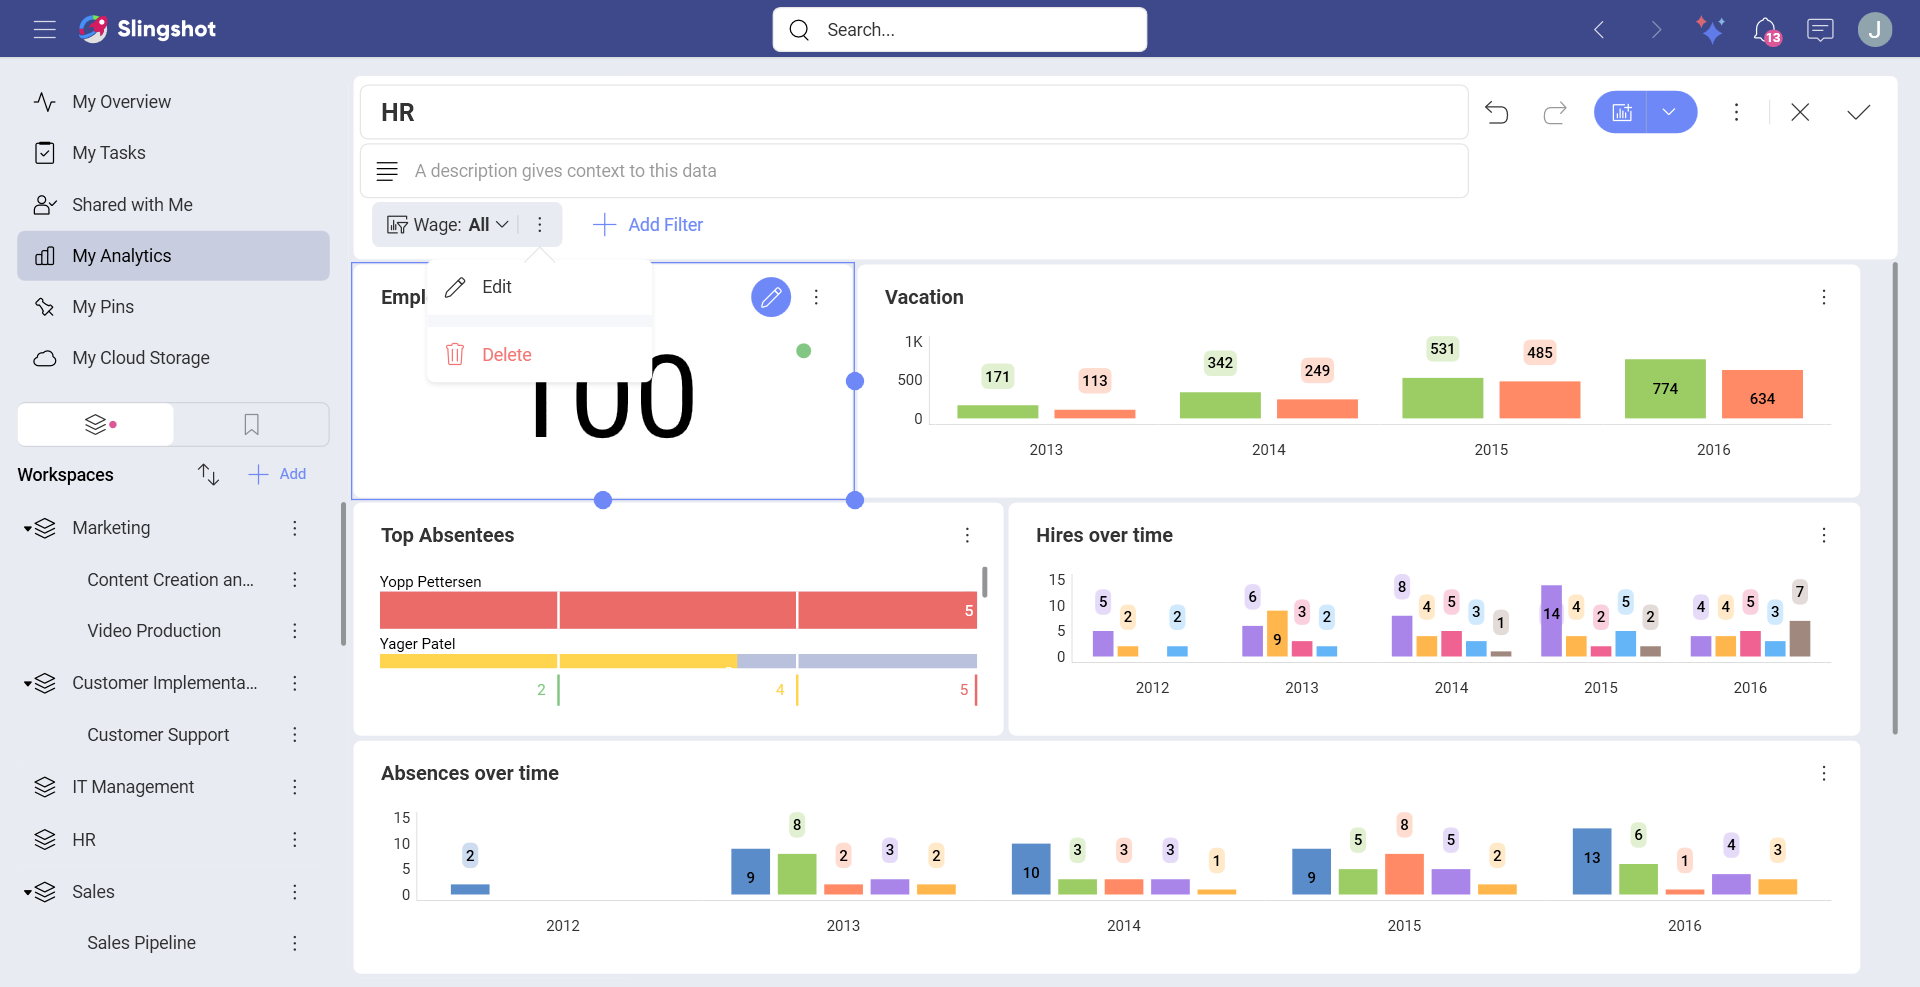
You can change the displayed column in Edit mode by selecting the Edit button in the overflow menu next to the dashboard filter name.
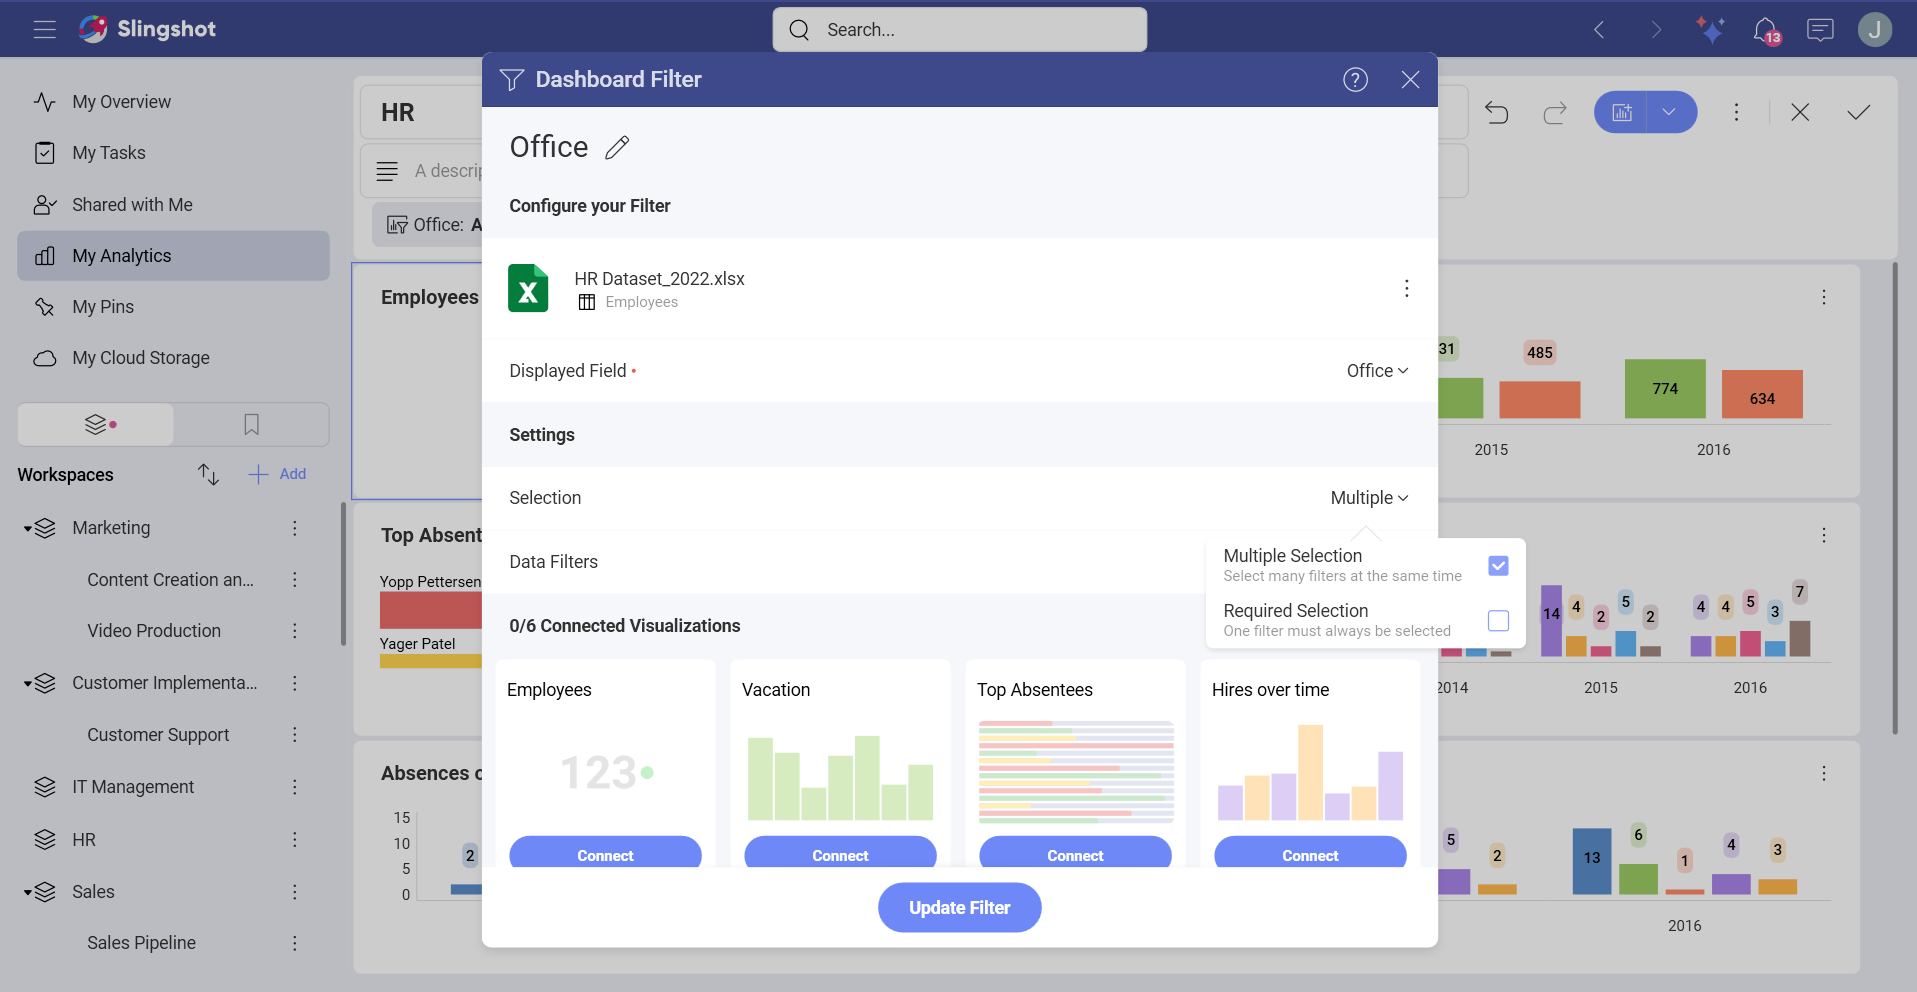
Multiple Selection
Analytics supports the selection of multiple dashboard filter values simultaneously. This is meant to enable side by side comparison between different elements in a collection. For instance, in the HR Dashboard dashboard you can compare the hires and absences over time of different offices by enabling multiple selection.
In order to enable Multiple Selection, you need to:
Switch the dashboard to Edit mode.
Choose Edit from the overflow menu of a dashboard filter.
Click/tap on Selection.
Tick the Multiple Selection checkbox.
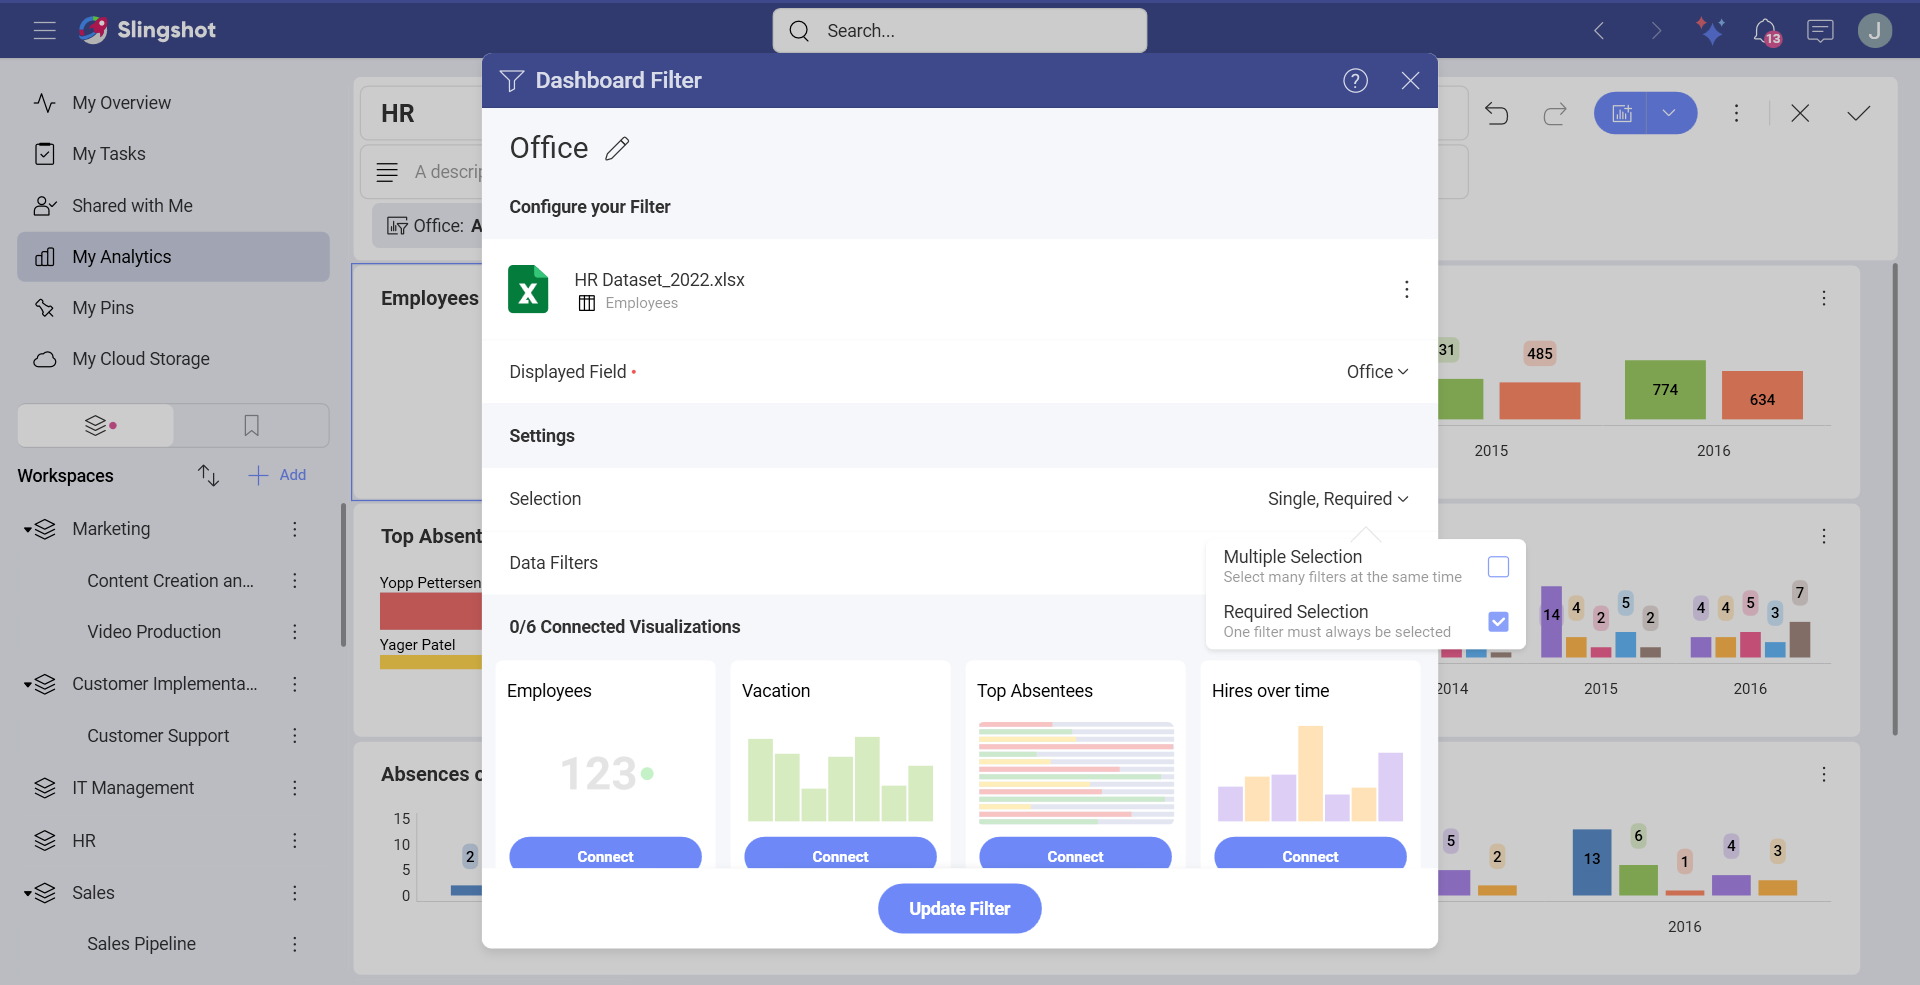
Required Selection
Dashboard filters can be configured to require a selected option or not. By default, selections are not required. Making selections optional allows the user to uncheck all dashboard filter values, which removes the filter from the performed query. The query retrieves all data from the data source, and No Selection is displayed in the dashboard filters row.
In order to enable Required Selection, you need to:
Switch the dashboard to Edit mode.
Choose Edit from the overflow menu of a dashboard filter.
Click/tap on Selection.
Tick the Required Selection checkbox.
Data Filters
You can also apply filters to the fields in the dataset displayed in the Dashboard Filter. This allows you to filter out null or empty values on a specific field (empty values filter). You can also select specific values, or add rules to your field in order to change the options depending on the field type. For more information, visit the field filters and rules section.
For example, if you use the Fullname field to filter the data in your HR Dashboard, the Dashboard filter will show a list of all employees in all offices of the company:
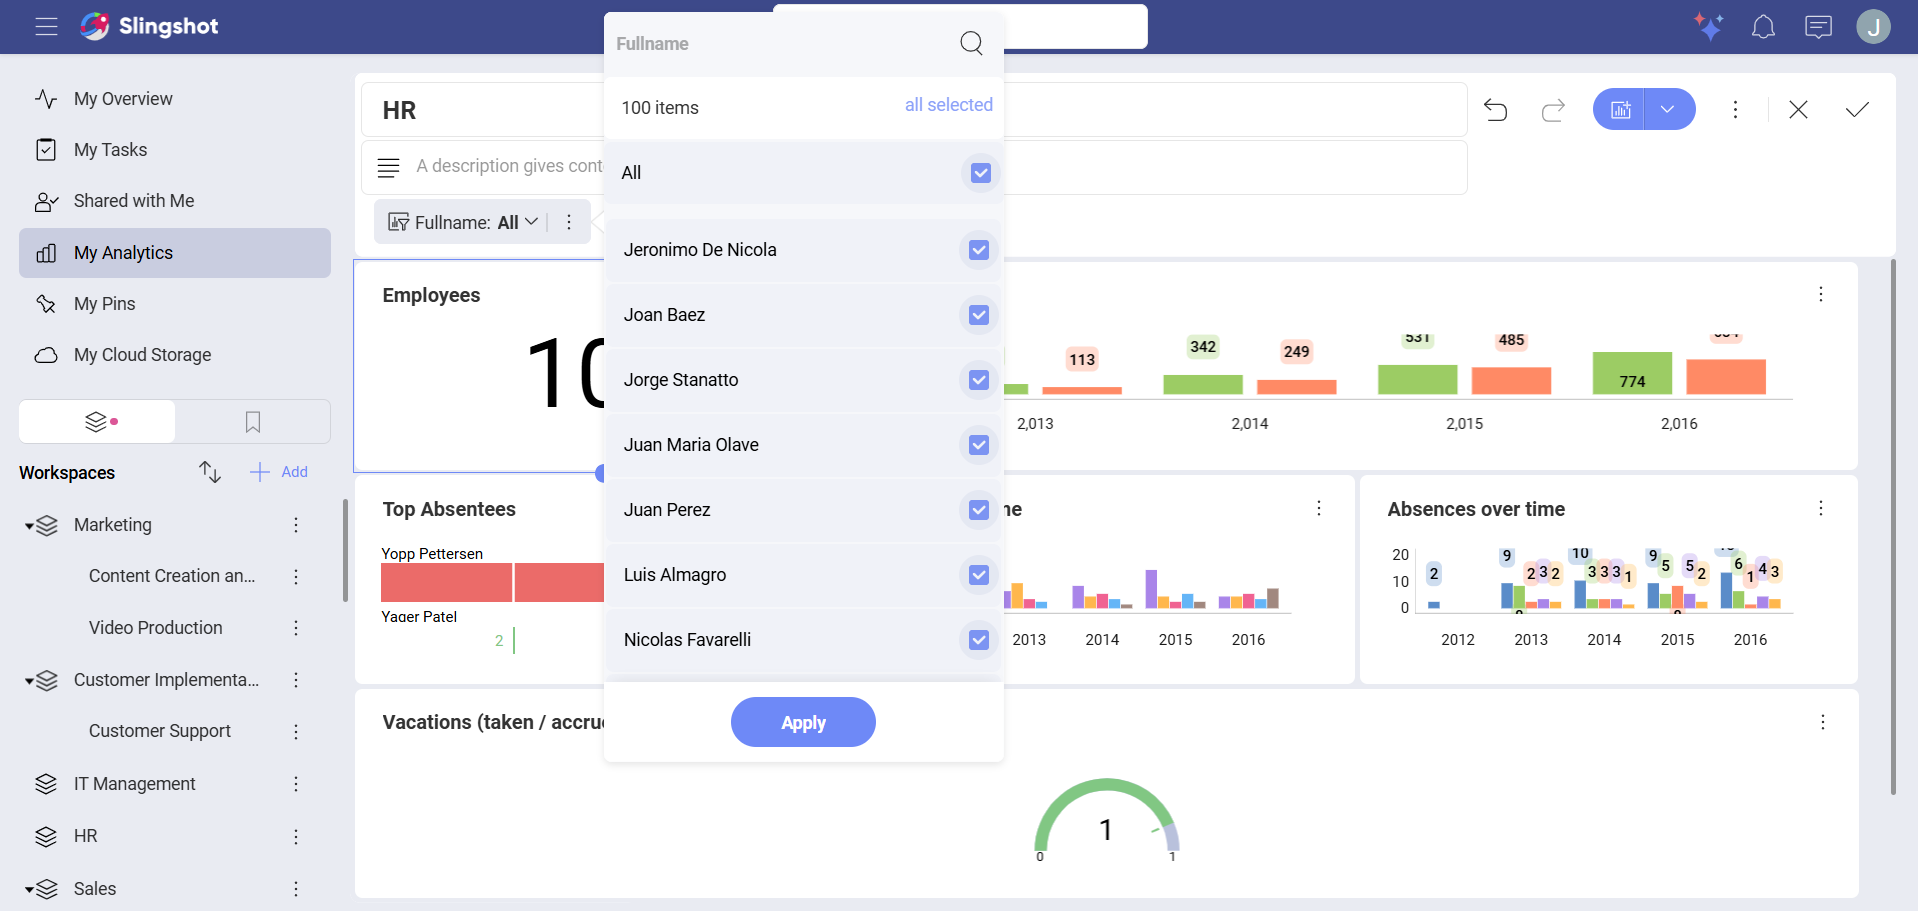
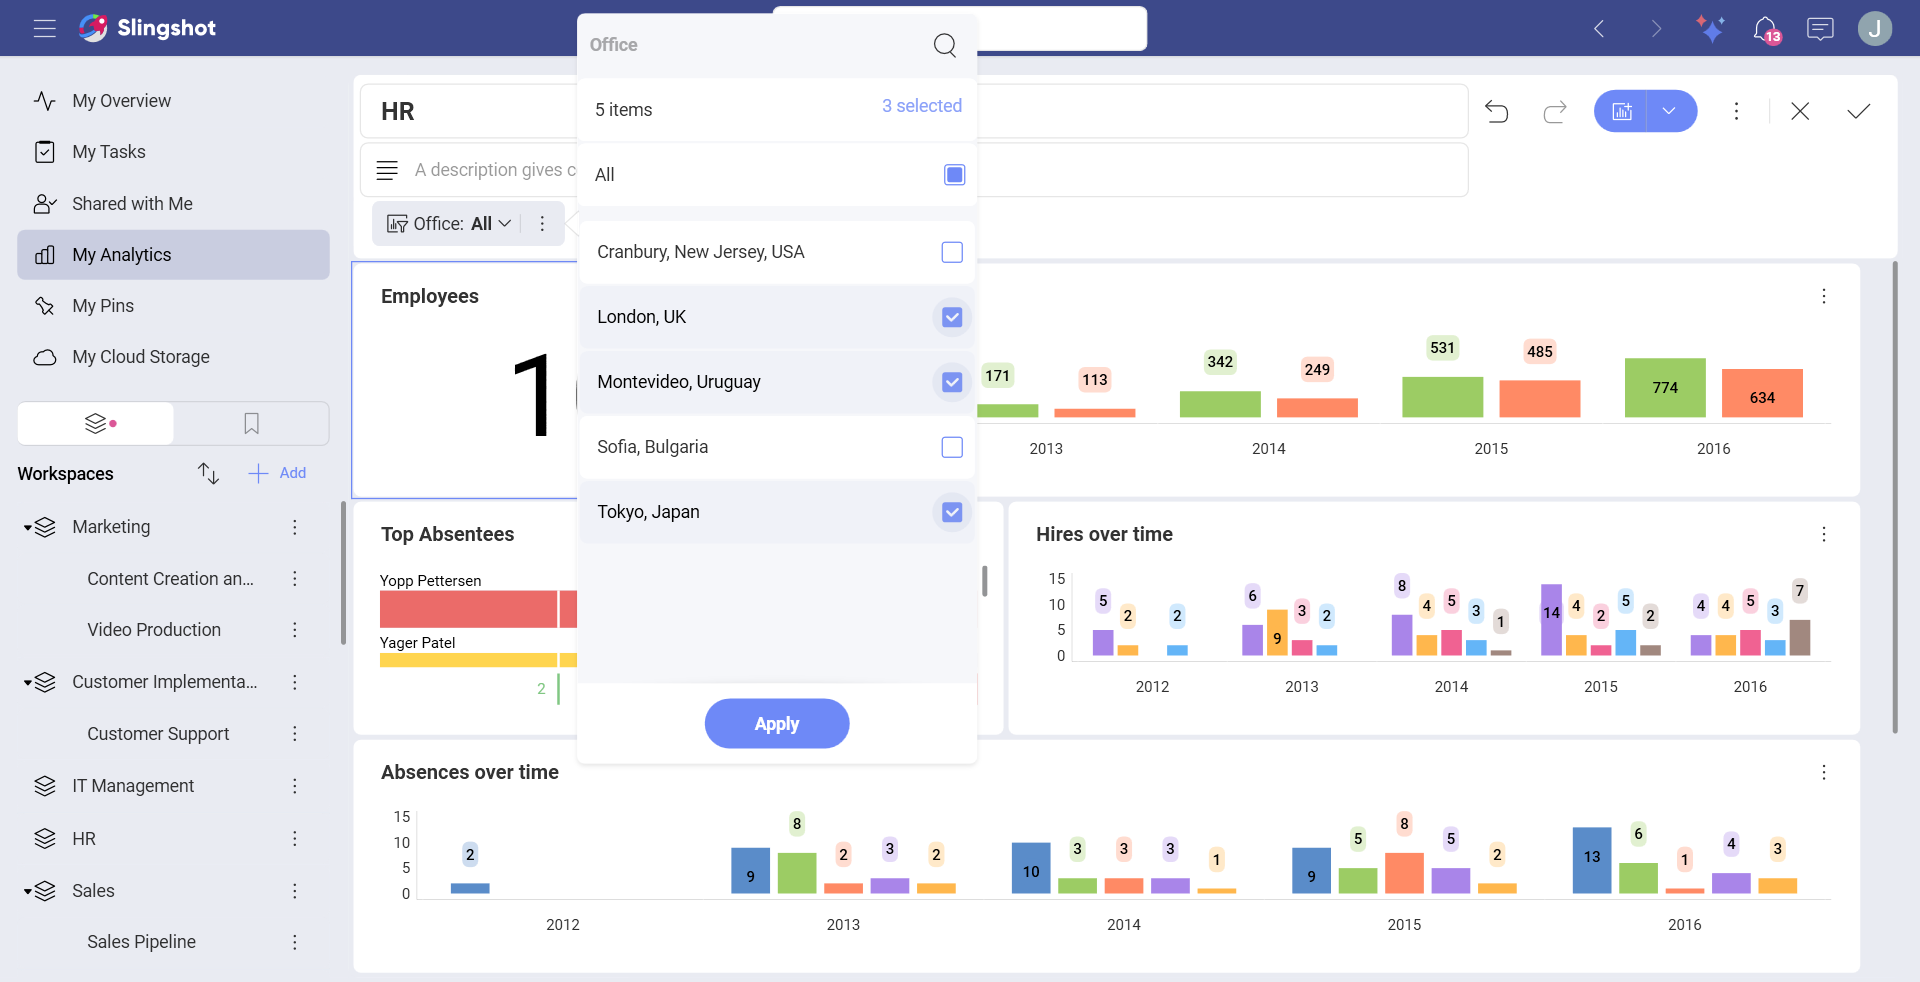
If you want your filter list to contain only employees working in a particular office, e.g. London, UK, apply a data filter as shown below.
Applying a data filter to your dashboard filter
To apply field filters and rules to the data source used as a dashboard filter and have the dashboard filter show only the employees in the London, UK office (as in the example above), follow these steps:
Go to Data Filters in Dashboard Filter settings.
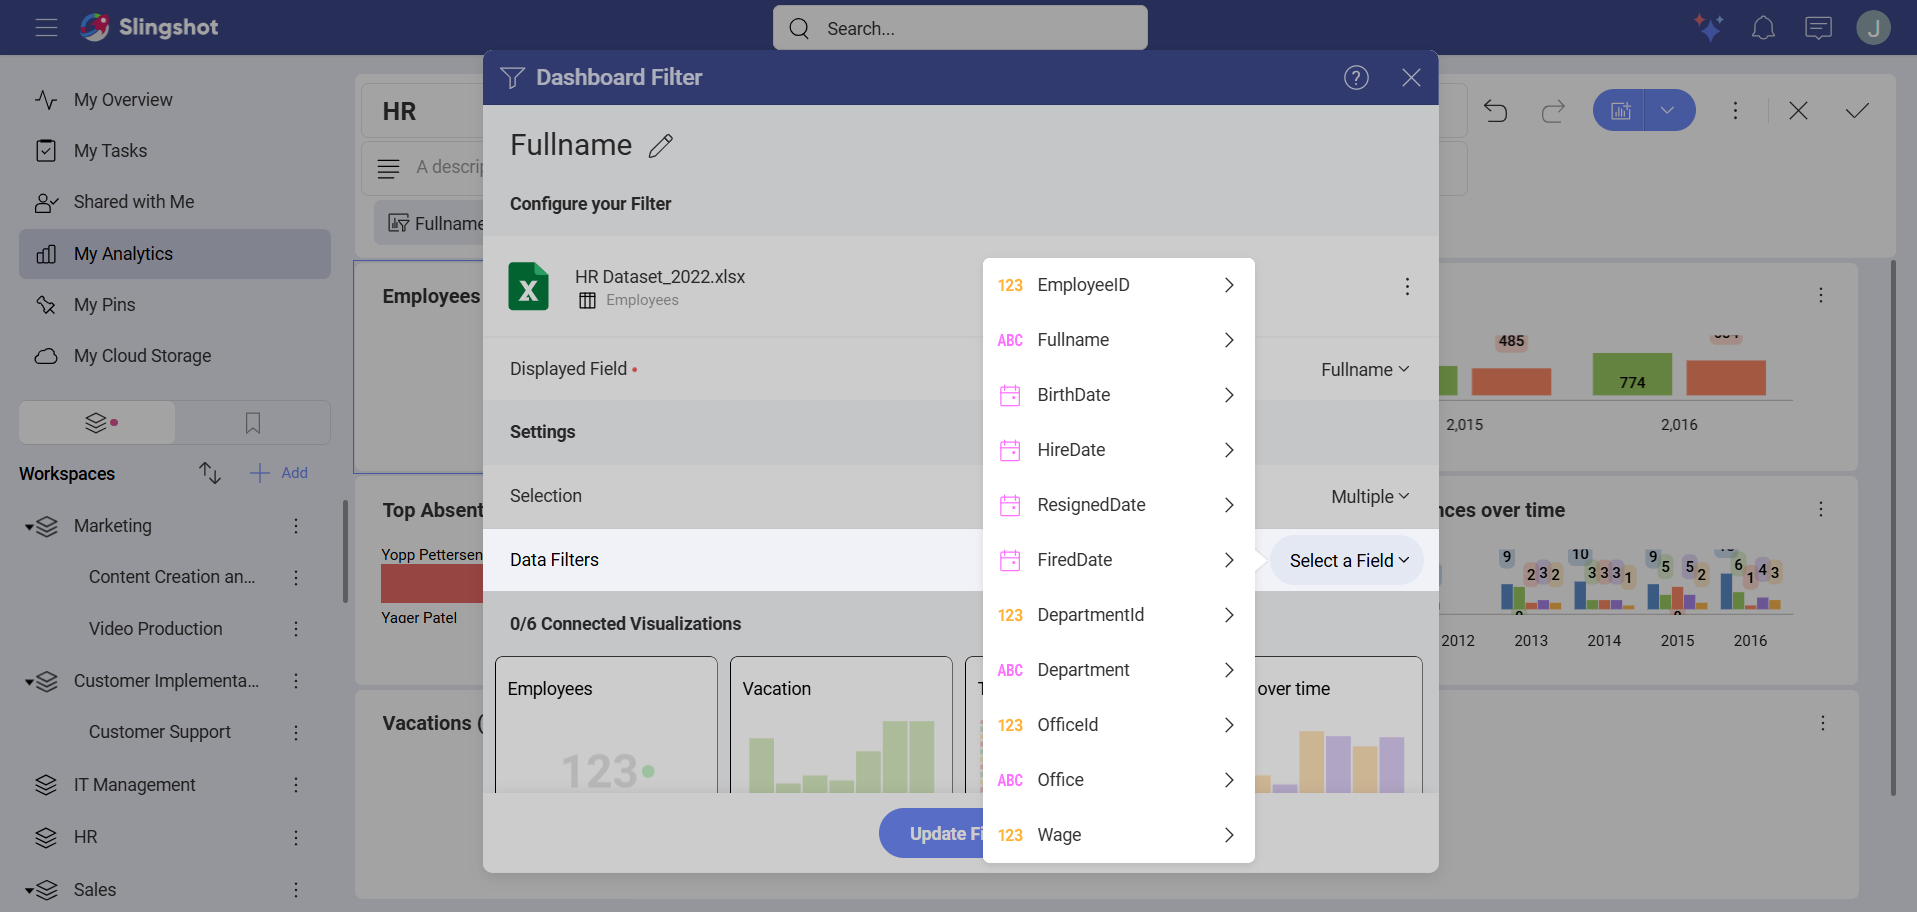
Select Fullname for the Displayed Field property.
Click/tap on Select a Field and choose Office from the list.
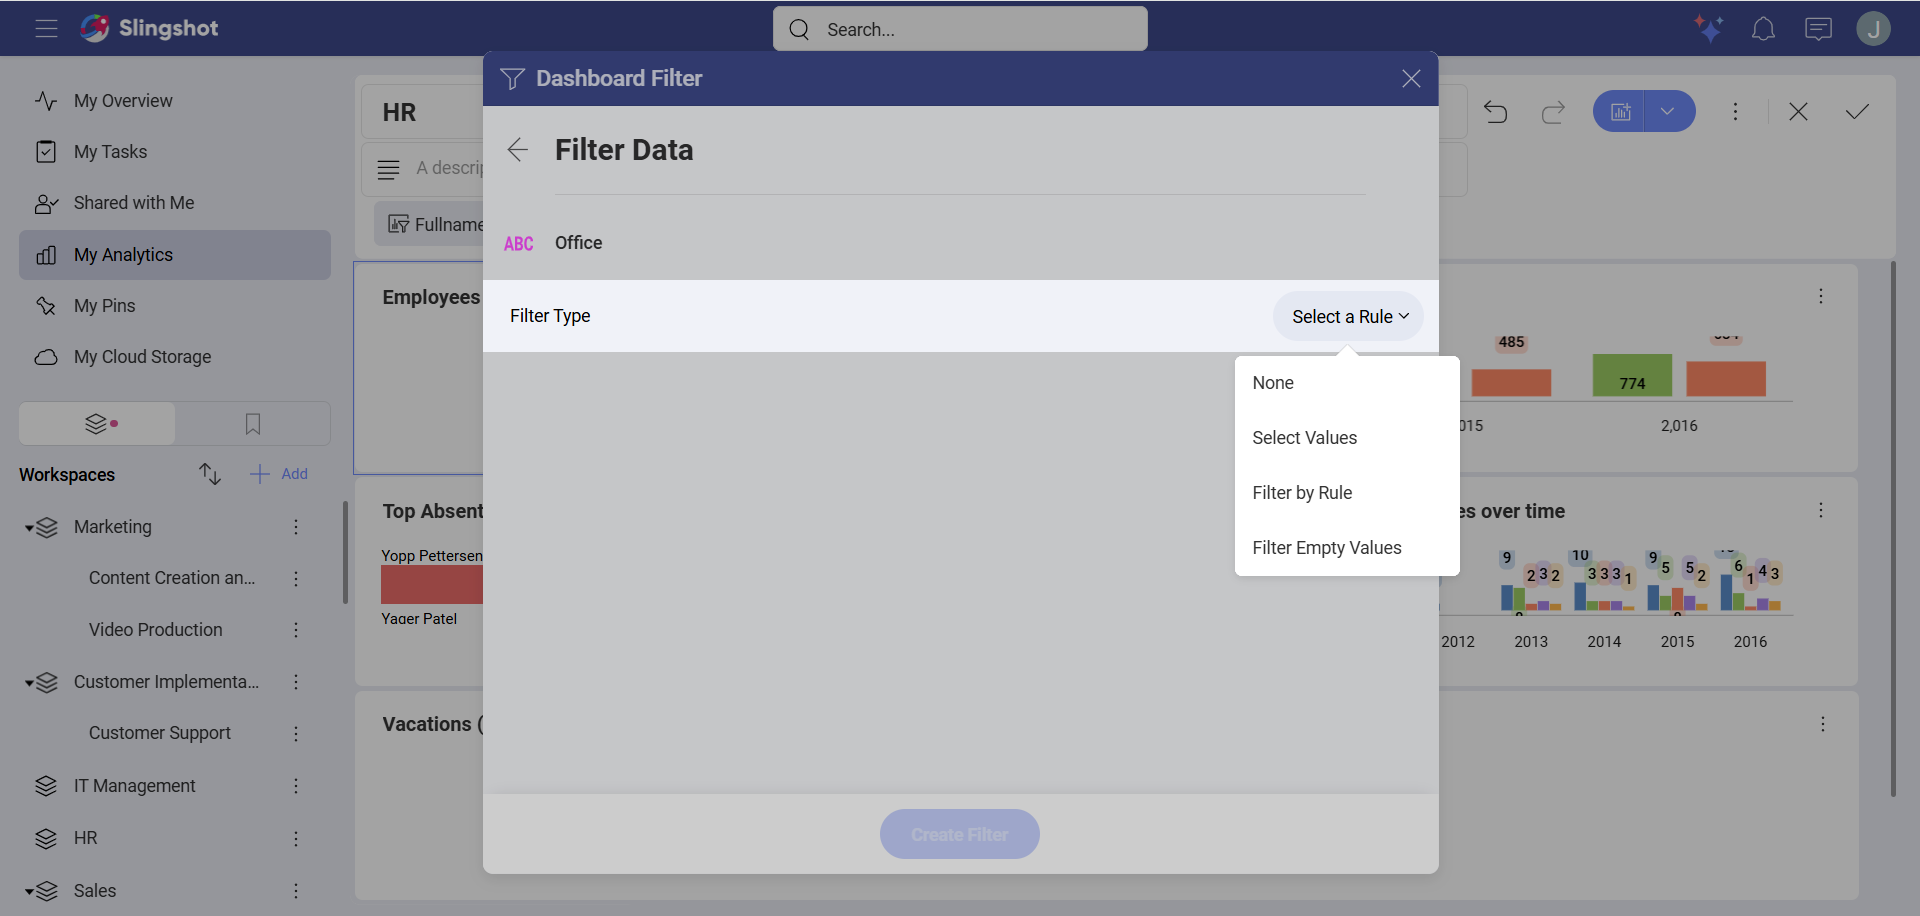
- In the following dialog, select the filter type you want to apply (choose Select Values for the purposes of this example):
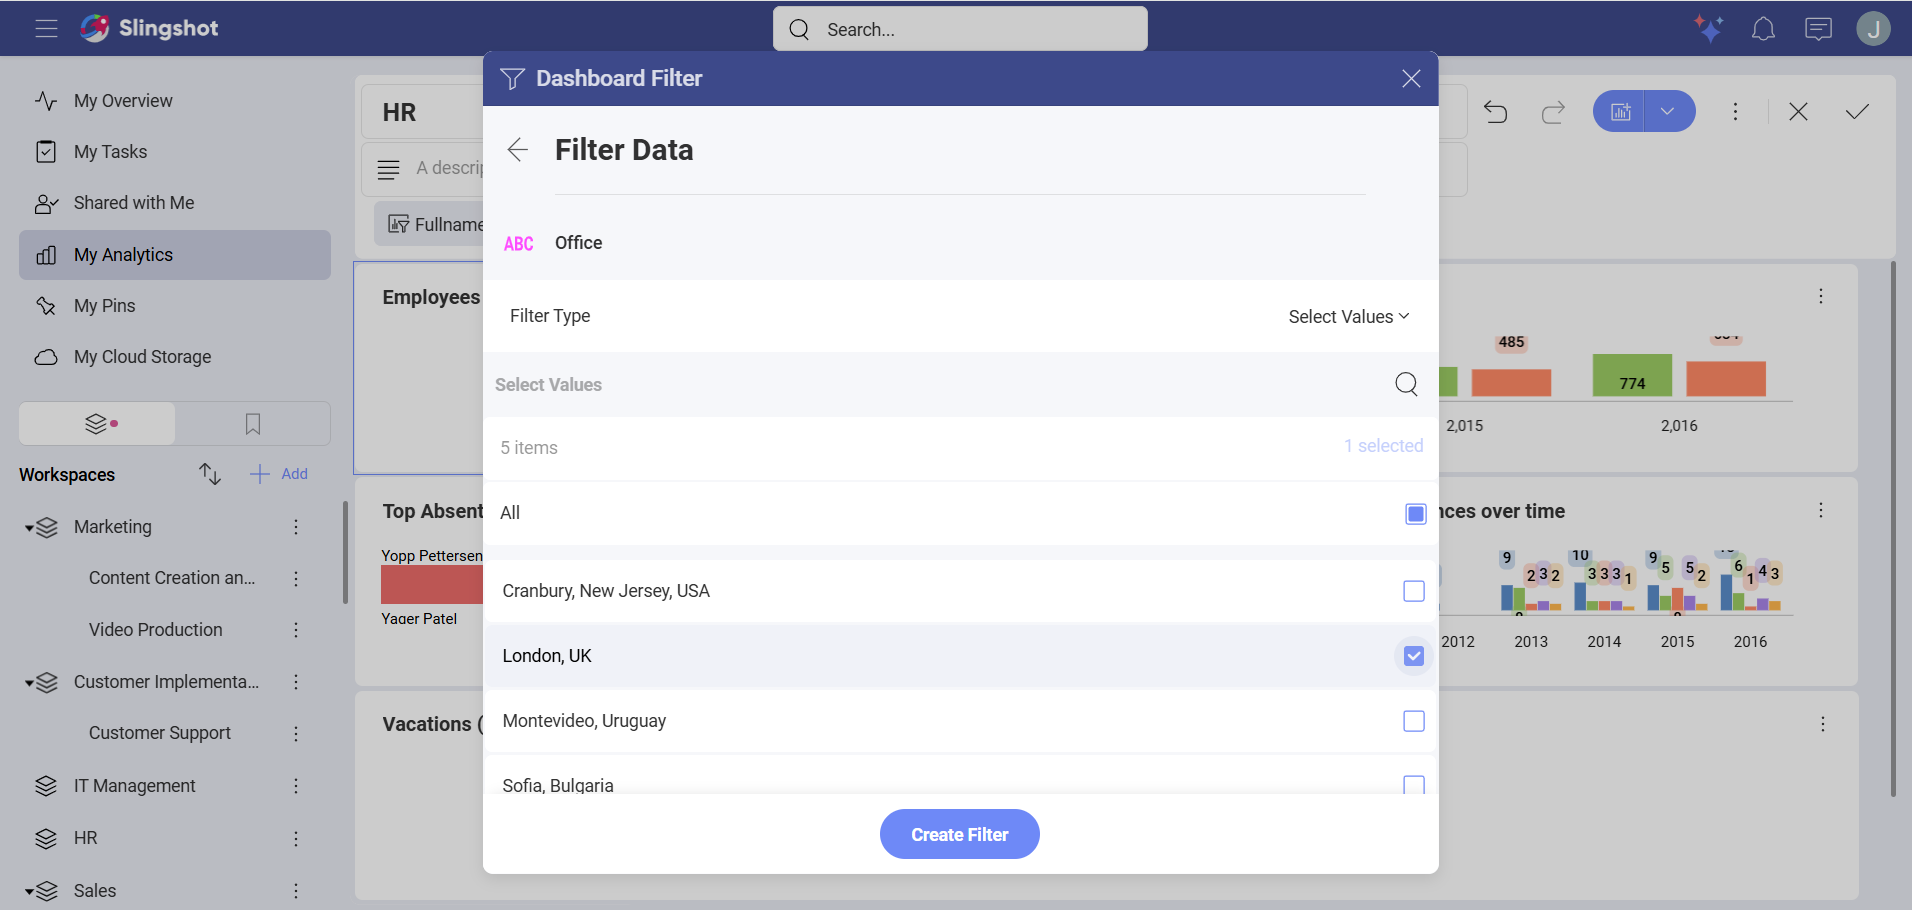
- Choose London, UK from the list and click/tap on the Create Filter button.
Dashboard Filters Using Microsoft Analysis Data
There are some specifics when configuring an MS Analysis dashboard filter.
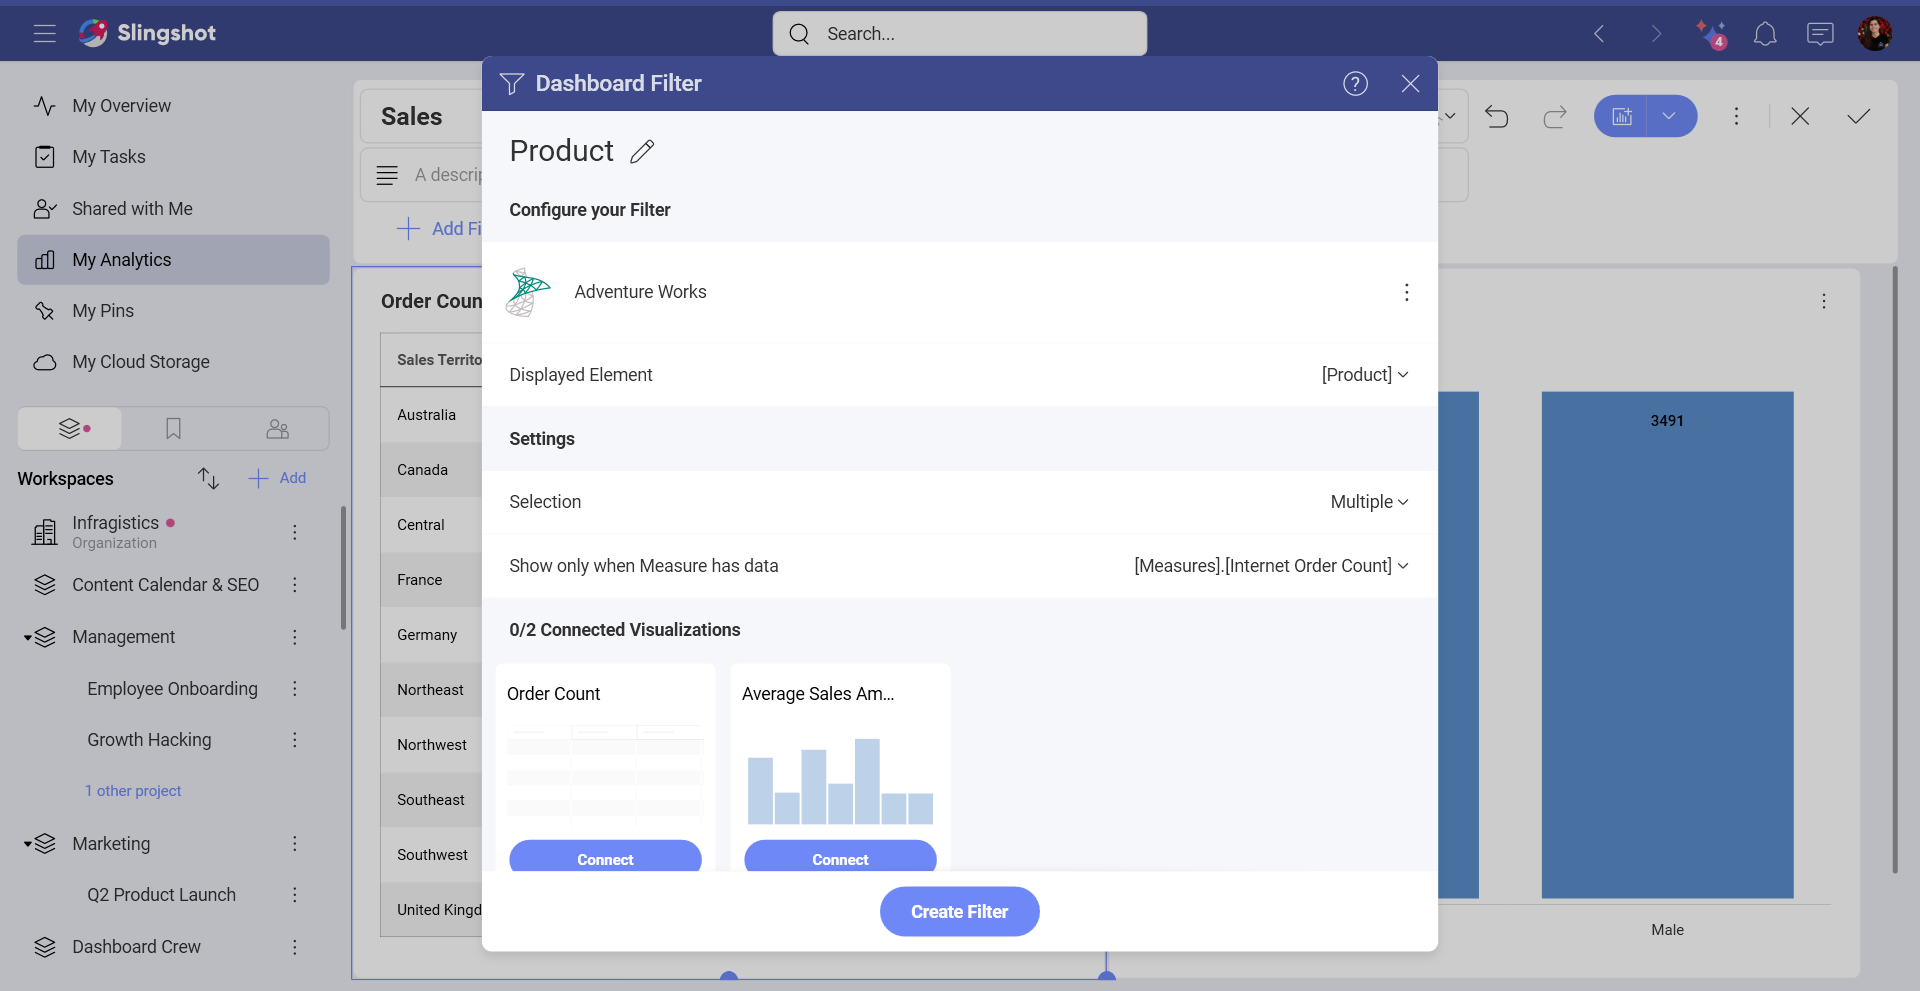
Displayed Element - you can select a Dimension, Hierarchy or Level data field to display dashboard filter values, but not a Measure data field.
(Optional) Show only when Measure has data - select a Measure to limit the dashboard filter list to values that contain data for a certain Measure.
Look at the screenshot above. In this example, the Product Dimension is selected as a Displayed element, so the dashboard filter will show a list of products (e.g. bikes, clothes, etc.). By additionally selecting the Internet orders Measure for Show only when Measure has data field, you will exclude dashboard filter values, which do not contain information about the Internet orders Measure. So, if there are no internet orders of the product bike, bike will not show up as a possible selection in the Dashboard Filters list.
Next Steps
Now that you have already created your dashboard filter, you will need to connect it to the visualizations you want to apply filtering to. To learn more about this, please read Connecting Dashboard Filters to a Visualization.