Connecting Dashboard Filters to a Visualization
Binding the data in a visualization to a dashboard filter can be done in two ways:
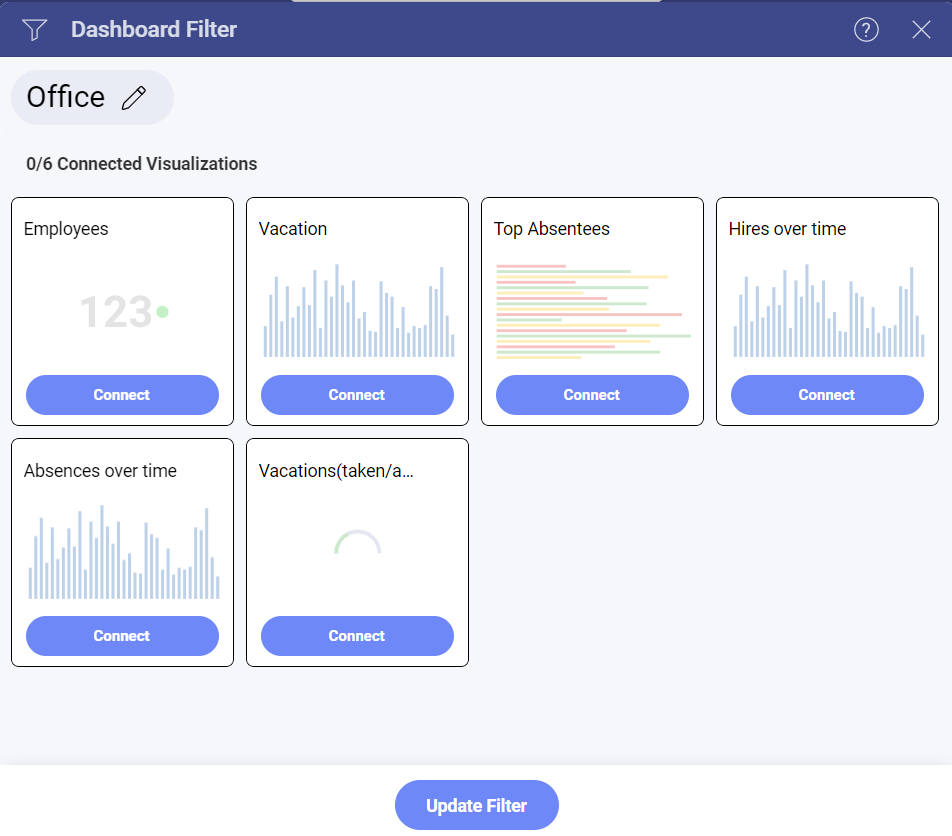
As part of the Dashboard Filter configuration (as shown above). This allows you to centrally configure binding between a dashboard filter and all visualizations in the dashboard.
Through the Visualization Editor (as shown below) so that you can bind an individual visualization, even after the dashboard filter has been created.
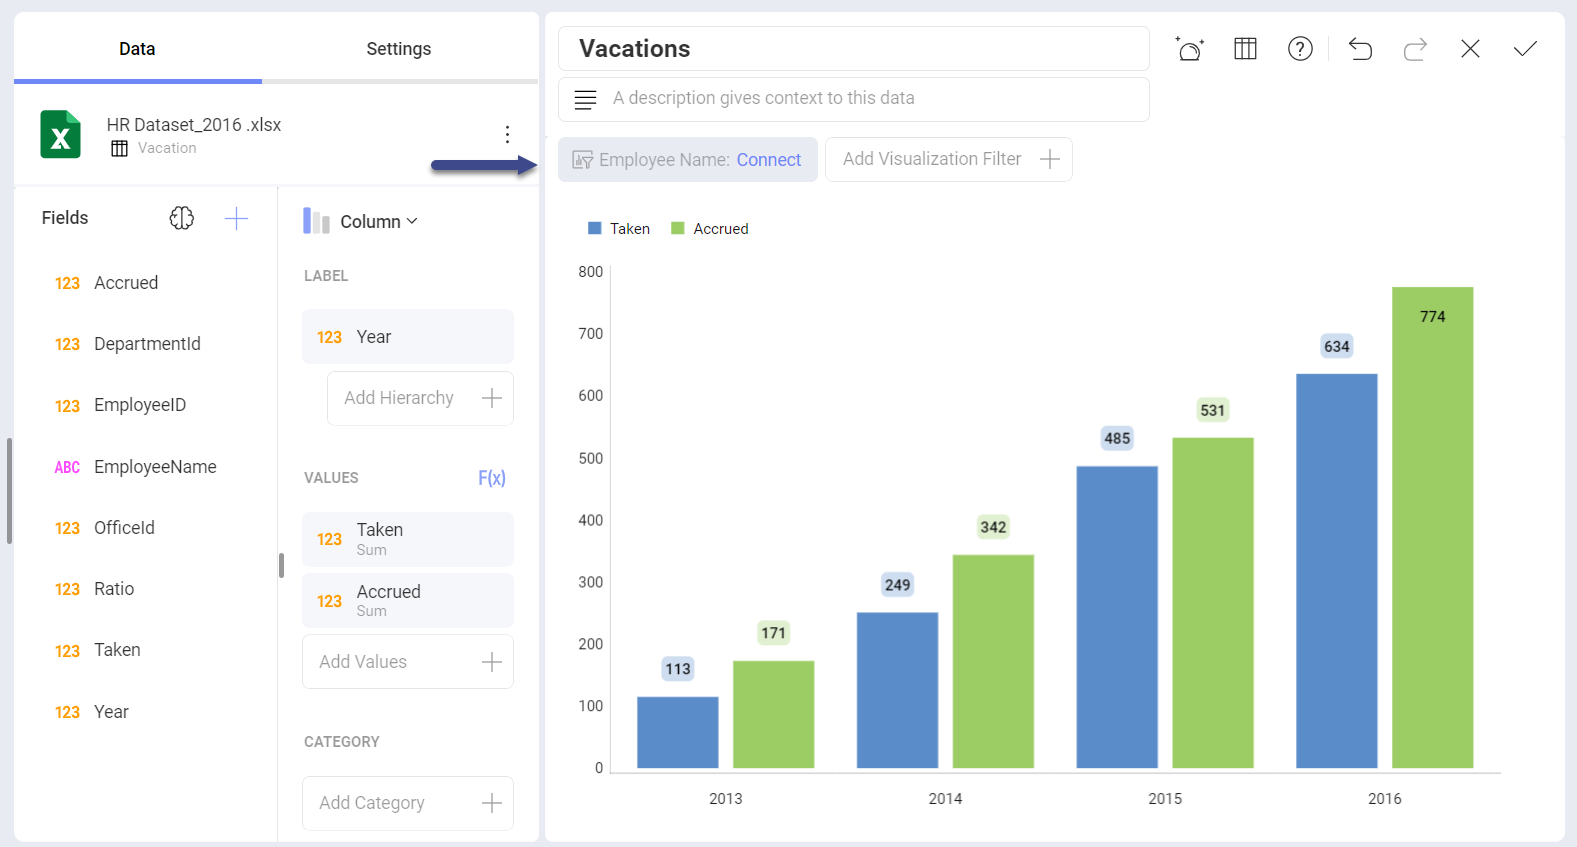
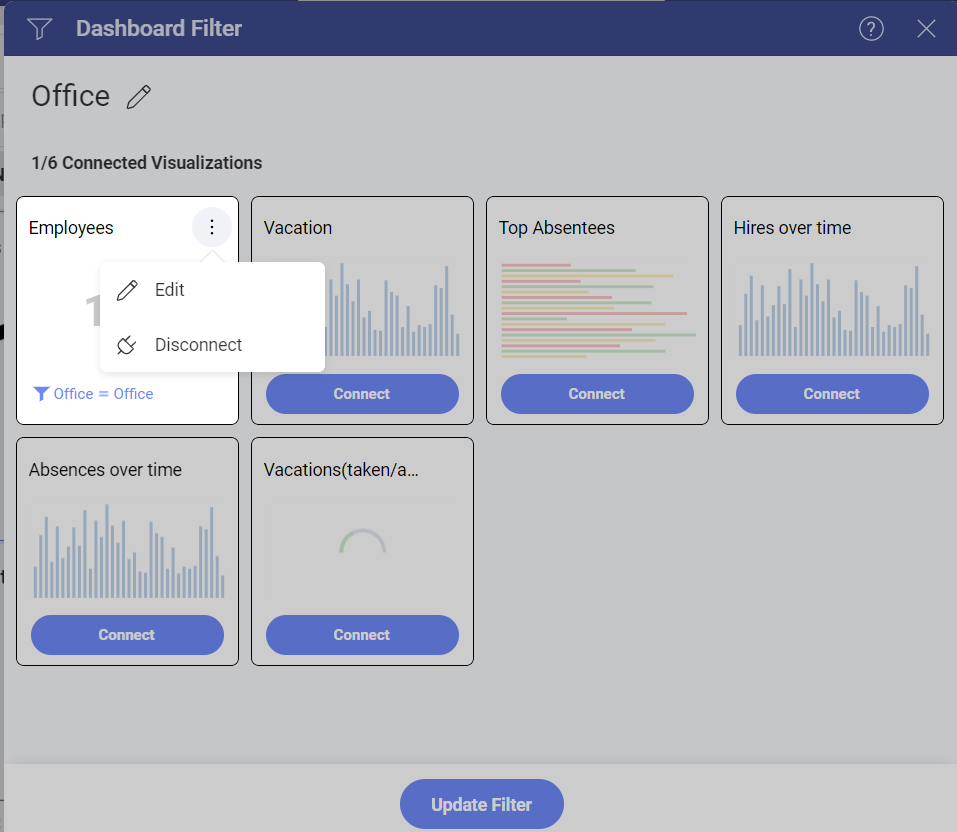
In both cases, binding is defined by adding rules that link a field in the dashboard filter dataset with a corresponding field in the visualization's dataset (field binding). You can always remove a visualization's binding by selecting Disconnect in the Visualization Editor or the Dashboard Filter menu.
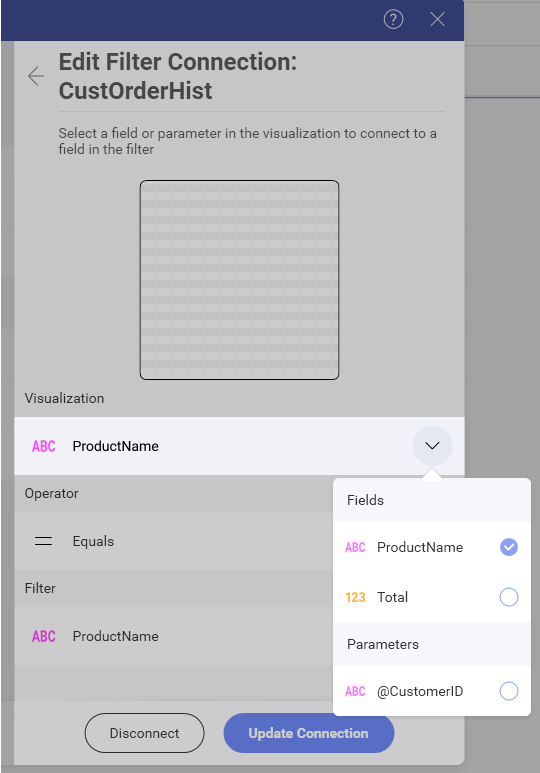
Field Binding
Field binding allows you to configure a join relationship between the dashboard filter dataset schema and the visualization's schema. To do this, select the Dashboard Filter you want to use and then Connect.
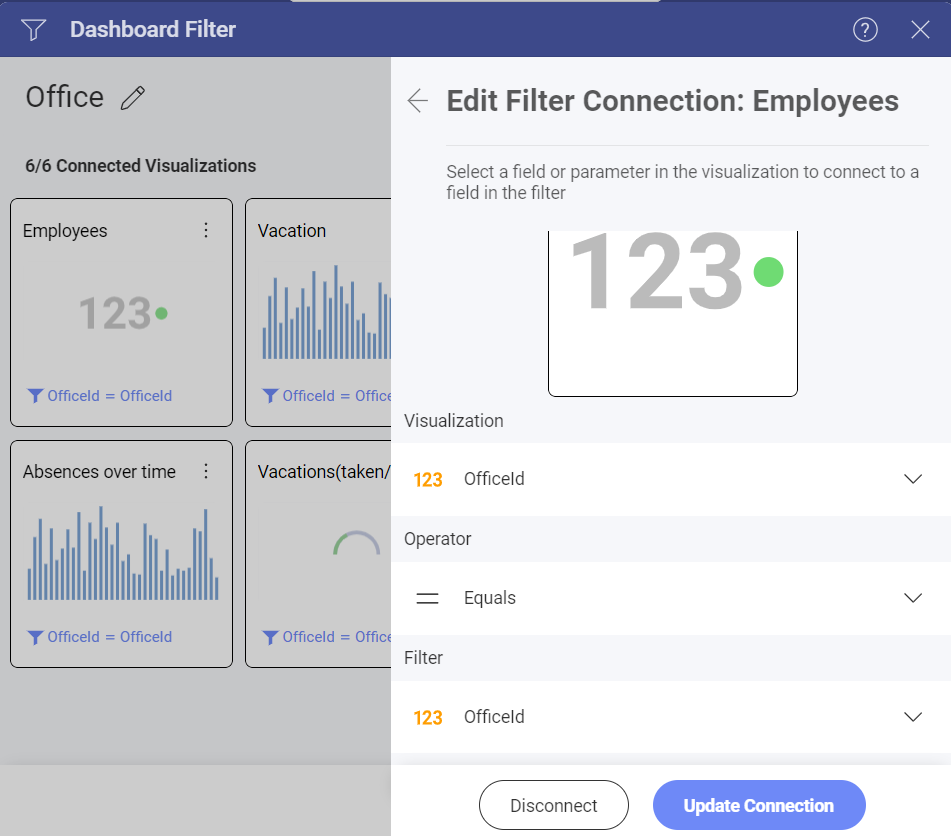
In the dialog above, you will need to configure:
Visualization: this represents the column in the visualization's dataset that will be used as key to join with the dashboard filter dataset. For example, Office, EmployeeID, ProductID, etc.
Operators: the join operators to use, which can be one of the following:
Is Equal: requires that both the field value and the dashboard filter selection be exactly the same.
Contains: meant to be used with string fields, it returns a match that is enabled when the field value contains the dashboard filter selection. For instance, Visualization=
FRANCECONTAINS Filter=FRA.Between: this is only meant to be used with Date Range dashboard filters.
Filter: the specific dashboard filter from the dashboard filters list that will be joined.
Parameters Binding
For data sources with parameters (REST, OData and Stored Procedures in MS SQL Server) you might need to connect the dashboard filter to a parameter, so when you change the filter data for the visualization, it will be refreshed with the selected value in the connected parameter.
To connect a dashboard filter to a parameter, follow the procedure in Field Binding. You will find your data source parameters at the bottom of the Vizualization's drop-down list in the Edit Filter Connection dialog:
[!NOTE] Date Filters You can bind only dashboard filters to parameters. Date filter binding to parameters is not supported.