Sales Dashboard Tutorial
In this tutorial, you will see how the "Sales Performance" dashboard displayed below was created using a sample spreadsheet with similar data.
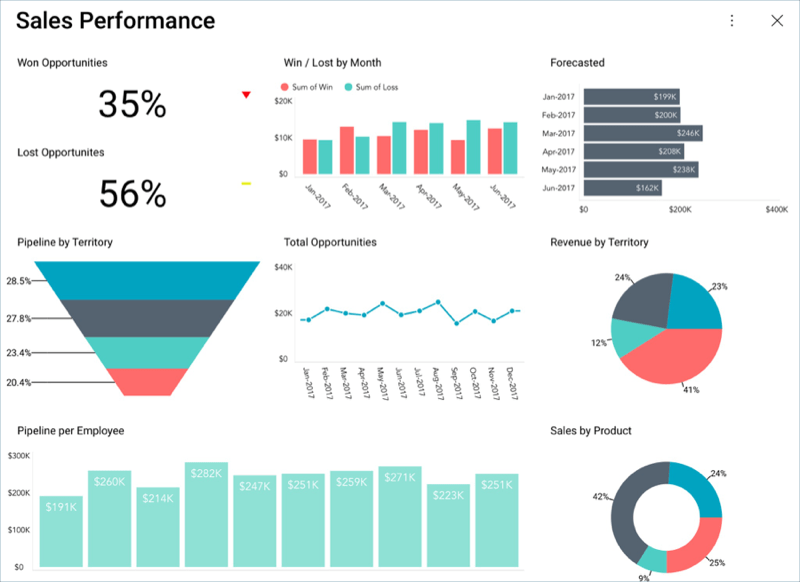
What's in this Dashboard?
This dashboard contains information on a sample company's:
Current Sales performance across teams and territories
Under-achieving and over-performing product lines
Win/loss metrics
Sample Data
You can download the sample datasheet here. All other dashboards in these tutorials will use the same sample spreadsheet.
Note
Excel files as local files are not supported in this release. In order to follow these tutorials, make sure you upload the file to one of the supported cloud services.