How Stephen Gould Scaled Its Capacity by 30% without Making a Single Hire

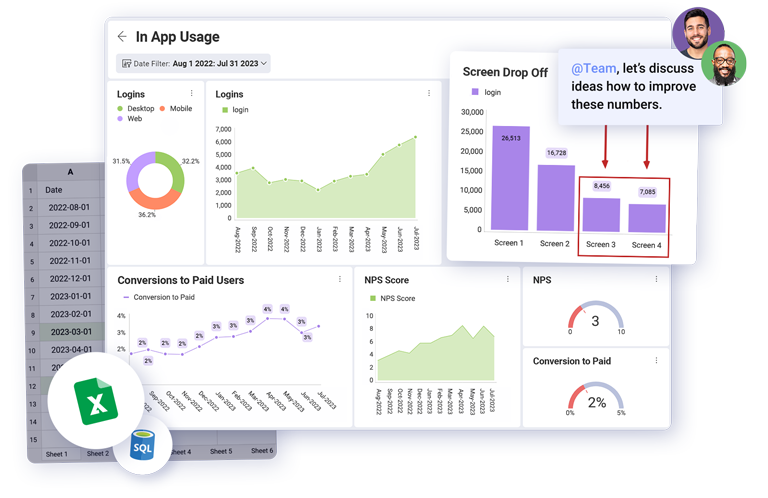
Juggling data from multiple sources and manually pasting it into Excel is time-consuming and tedious. Slingshot seamlessly brings your data directly from the most popular data sources and Excel together so you can automate insights – in minutes. Spend less time managing data and more time acting on it.
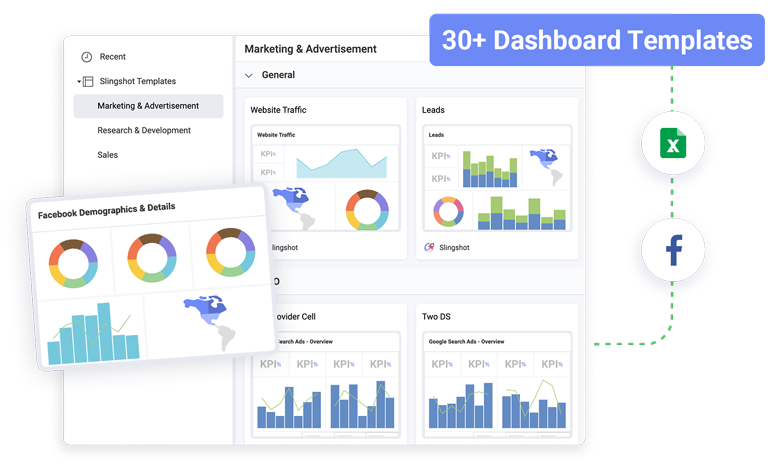
With Slingshot's pre-built dashboard templates, you don't have to be a data expert to create visually stunning, actionable dashboards. Simply choose from our library of templates, connect your data sources, and watch as Slingshot transforms your data into beautiful visualizations in a matter of seconds.
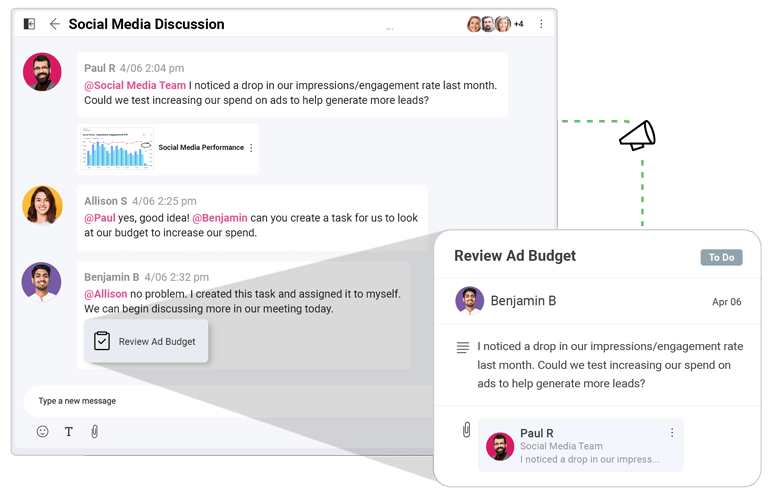
Connect data directly to your team's workflow and conversations, initiating chats effortlessly from dashboards. With a single click, transform insights into actionable tasks. Keep dashboards organized, easily accessible in workspaces, projects, and data catalog, ensuring data transparency for everyone.
Slingshot pulls your data insights together by integrating the most popular data sources to choose from.










Data without visualization is hard to understand. Sifting through Excel spreadsheets can be exhausting, and not so intuitive when it comes to showing and discussing important insights with other parties. See how you can pull your Excel raw spreadsheets into beautiful visualizations in the video below.