Exporting Excel
Analytics allows you to export the data used for your dashboards to the Excel format. Data for every visualization in your dashboard will be on a separate sheet in the Excel file.
Note
Export to Excel limitations. You can export to Excel only dashboards using table data, i.e. data sources organizing information into rows and columns (spreadsheets, CSV files, databases). If your dashboard uses images, HTML, etc. to visualize data, Analytics will not be able to export the information to the Excel format.
- Go to the overflow menu in the upper right-hand corner of the dashboard and select Export.
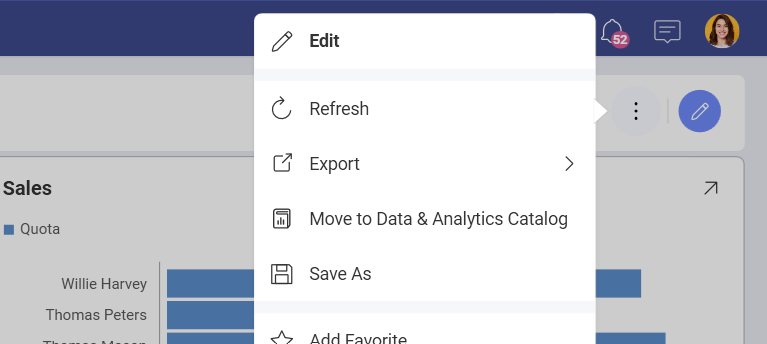
- The following dialog will open up:
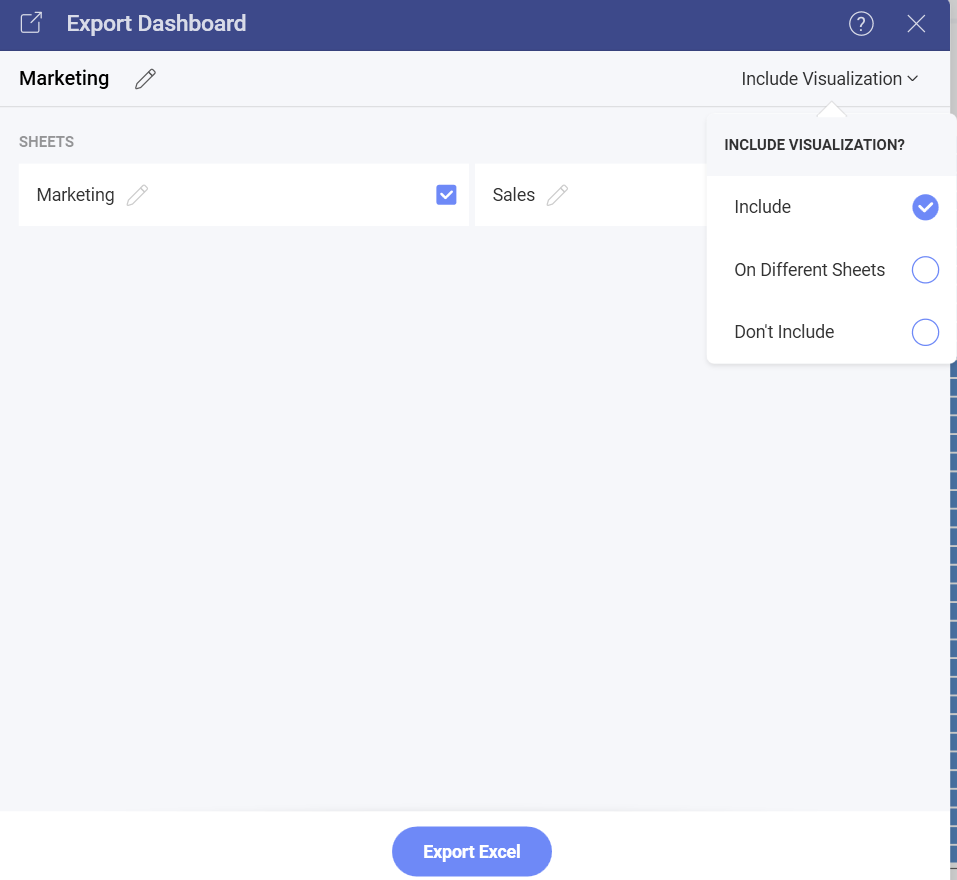
This Export Dashboard dialog allows you to select and rename the data sheets to be included in your Excel file. Every data sheet contains the data for a particular visualization in the dashboard you export. You can also include the visualizations in your Excel document.
The Include Visualization setting gives you the following options:
Include - include a dashboard's visualizations on the same sheet as the data for this visualization;
On Different Sheets - include visualizations and their corresponding data on separate sheets;
Don't Include - include only the visualizations' data in the Excel sheets.
Note
Supported visualizations. The following chart visualizations can be directly included in the Excel sheets: Column, Line, Bar, Area, StackedColumn, StackedArea, StackedBar, Pie, Doughnut, Funnel, Composite, Scatter, Bubble, Sparklines.
The following visualizations are converted to similar types before being included in the Excel sheet: Spline and StepLine ⇒ Line; SplineArea and StepArea ⇒ Area.