Exporting Dashboards as PDF Documents
Analytics allows you to export your dashboard as a PDF document. Every visualization that is part of this dashboard will be displayed on a separate page of the document.
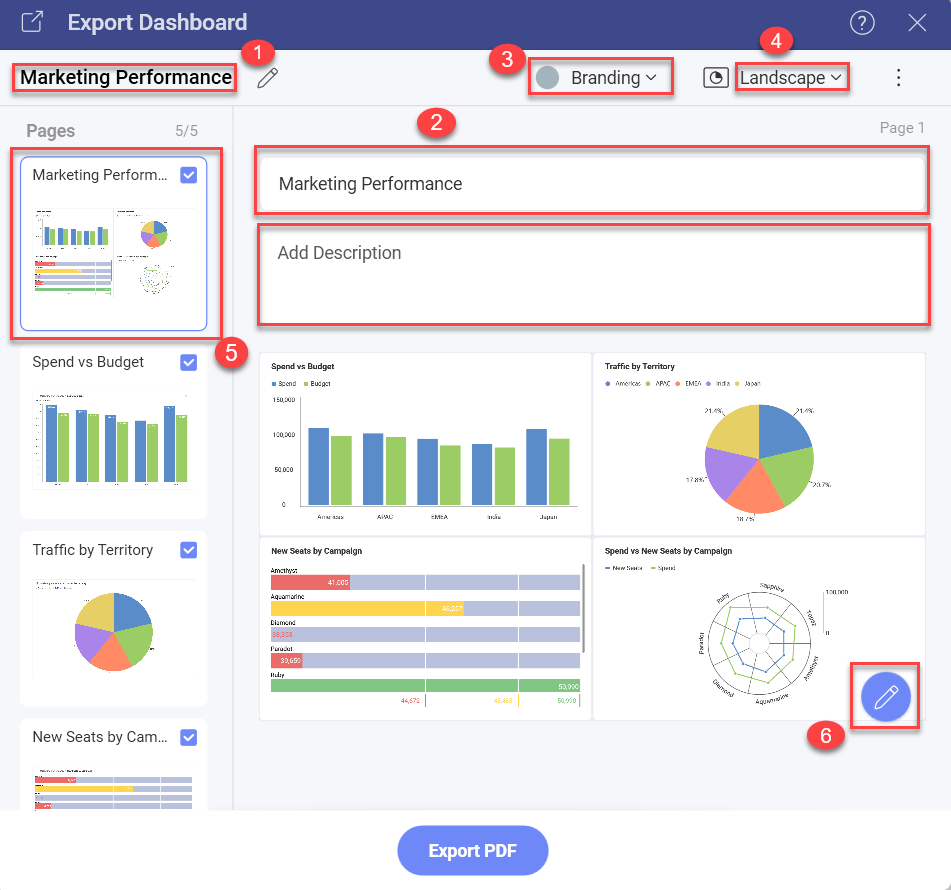
To export a dashboard as a PDF document, go to dashboard View mode and select: the overflow menu ⇒ Export ⇒ PDF. The Export Dashboard dialog will open, allowing you to edit your document and annotate specific pages, so that you can tailor it to your needs.
Export Settings
In the Export Dashboard dialog you can manage the following settings:
Change the main title of your PDF document. The default title is your dashboard's title.
Change the page's title and add a subtitle in the Enter Title text box (the second box). The default slide's title is the title of the visualization displayed on the page.
Manage Branding settings options allows you to choose:
Author's and their Company's name - displayed in the header panel of the document's pages;
company's logo displayed in the footer and color (the main color of the PDF document) - here you can choose one of the following options:
Analytics
User's organization/workspace - your organization and all of your workspaces having their branding (logo and color) set up are displayed as options. If you want to know how to access/change your workspace's branding settings, please read the Managing Workspaces topic.
Custom - select a color and upload a logo image of your choice.
[!NOTE] Requirements for logo images. The image you upload for a logo must be no bigger than 5 MB and one of the following formats: JPG, JPEG, PNG, GIF.
Choose between Landscape and Portrait document orientation.
You can manage your document pages by selecting a page from the list to modify its title, annotate or delete it (by removing the tick icon in the upper right corner).
Annotate the selected page by clicking/tapping the pencil icon. For more information about annotation settings, please refer to Annotating images in the Exporting Dashboards as Images topic.