Pivot Table
The Pivot Table visualization allows users to aggregate information by dropping fields in the corresponding placeholders of the Data sections.
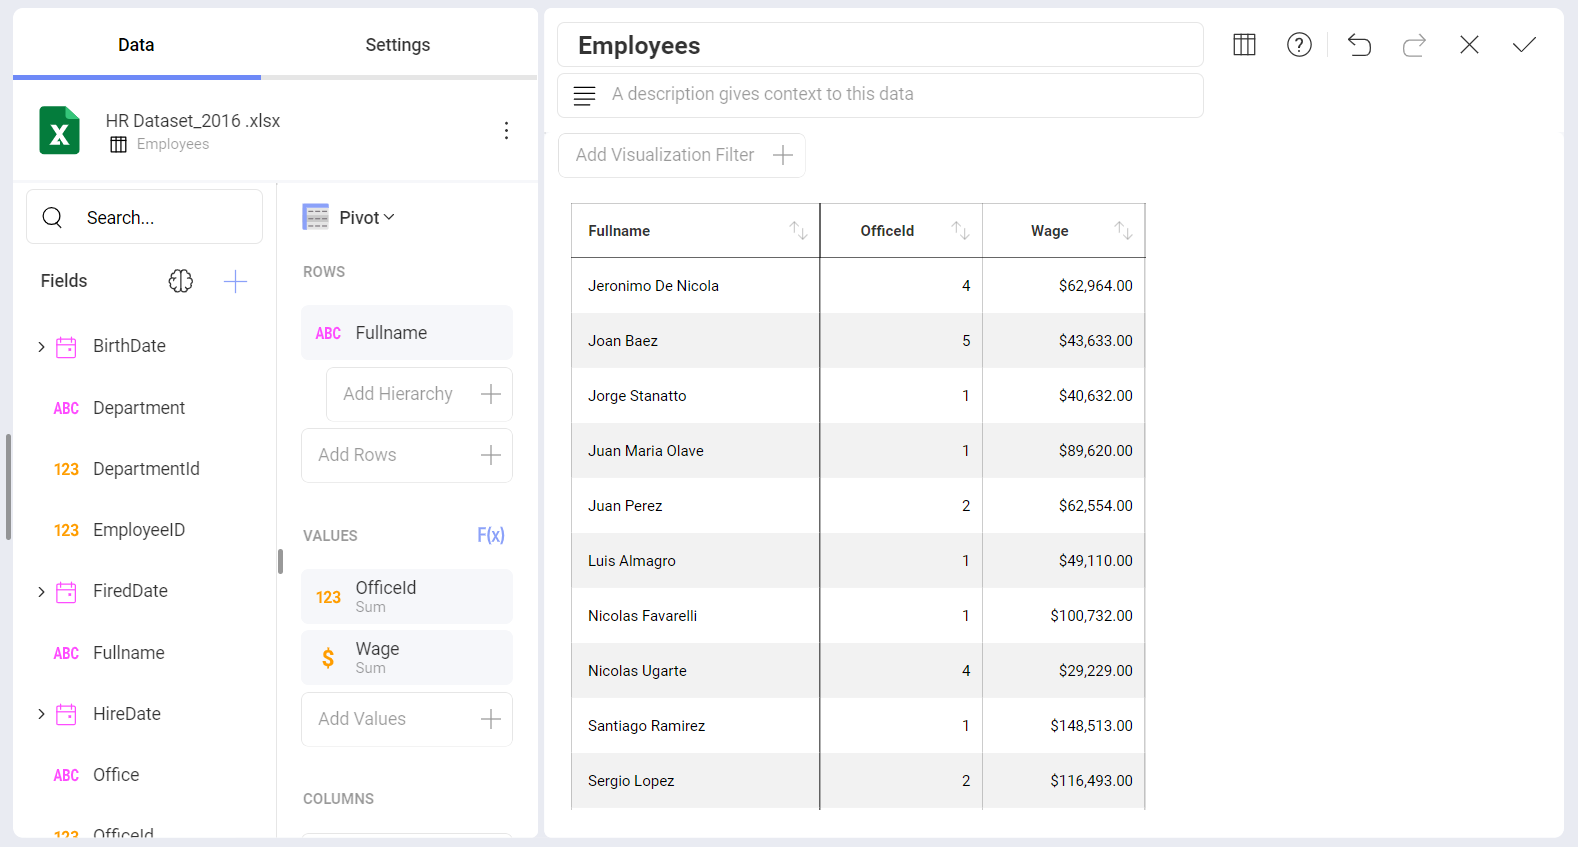
When a field is added to the rows, columns, or values data editor placeholders, selecting the field displays the summarized settings of that field:
For the fields in the Values placeholder, this means the ability to configure the summarization function used (average, count, sum, etc.).
For date fields dropped in the Rows placeholder, it means the ability to choose the level of detail in the summarization (day, month, year).
What is a Pivot Table?
A Pivot Table is a data summarization tool, which among other functions allows you to automatically count, average and total the data stored in a table like format, typically grouped by values. For instance if you have the following table:
| Salesman | Region | Product | OrderID | OrderTotal |
|---|---|---|---|---|
| JOHN A. | Americas | ProductX | 1001 | 10 |
| ERICK B. | Americas | ProductY | 1002 | 20 |
| PETE C. | EMEA | ProductX | 1003 | 30 |
| DAVID D. | China | ProductZ | 1004 | 10 |
| JORGE E. | Australia | ProductY | 1005 | 5 |
And you need to do the following type of analysis:
| Americas | EMEA | China | Australia | Total | |
|---|---|---|---|---|---|
| PRODUCTX | 10 | 30 | 40 | ||
| PRODUCTY | 20 | 5 | 25 | ||
| PRODUCTZ | 10 | 10 |
You can achieve it by using a Pivot Table where:
The Product field is dragged and dropped in the Rows placeholder so that all products are listed as rows.
The Region field is dragged and dropped in the Columns placeholder so that columns are created in a dynamic table for every value in the Region field.