Radial Charts
Like Category charts, Radial charts are simply representations of information in a coordinate system.
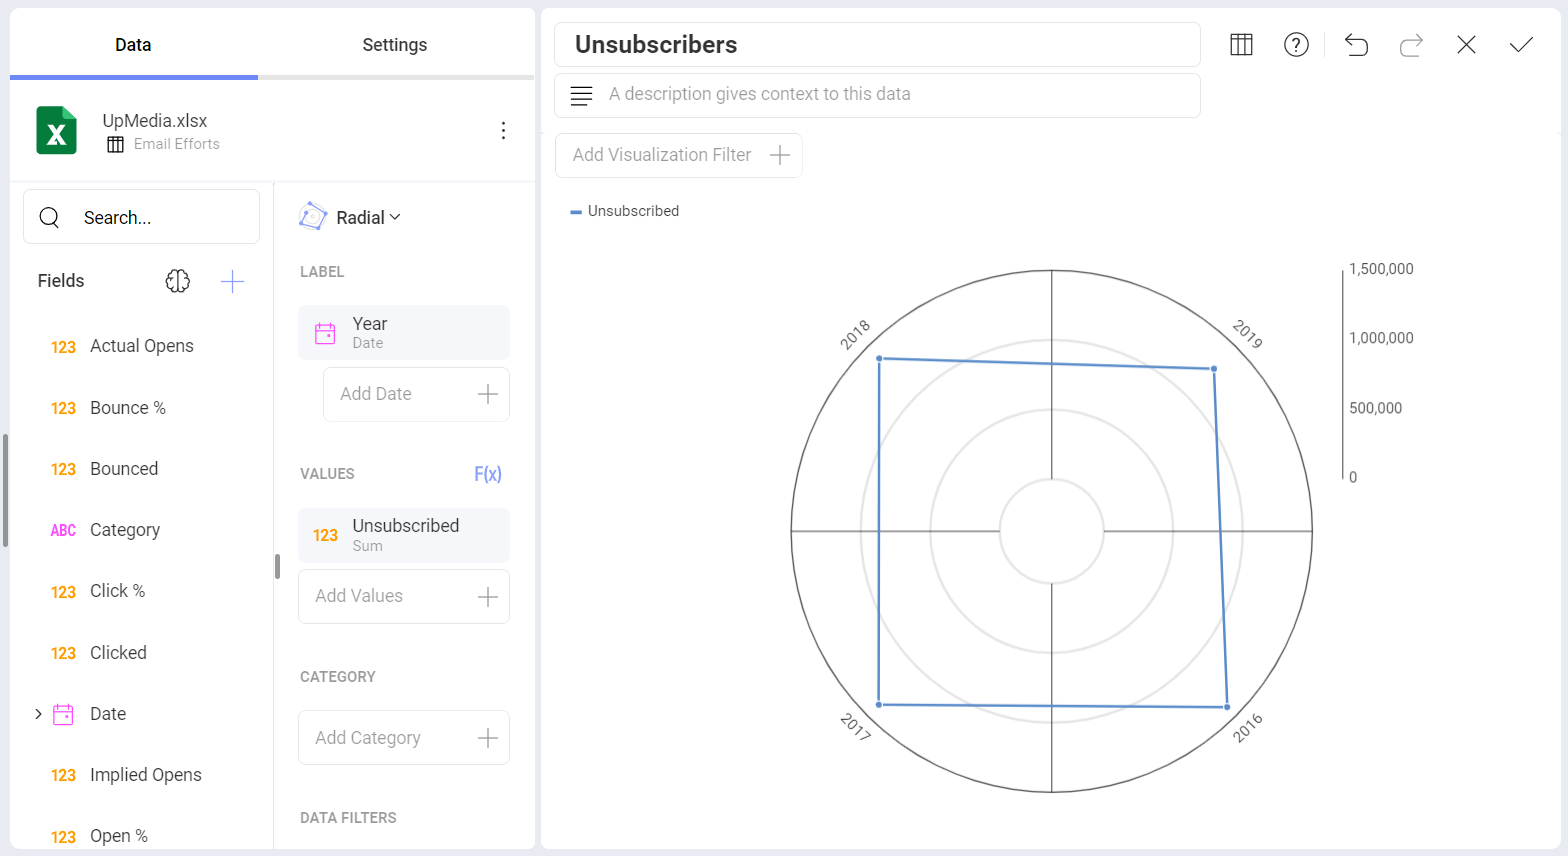
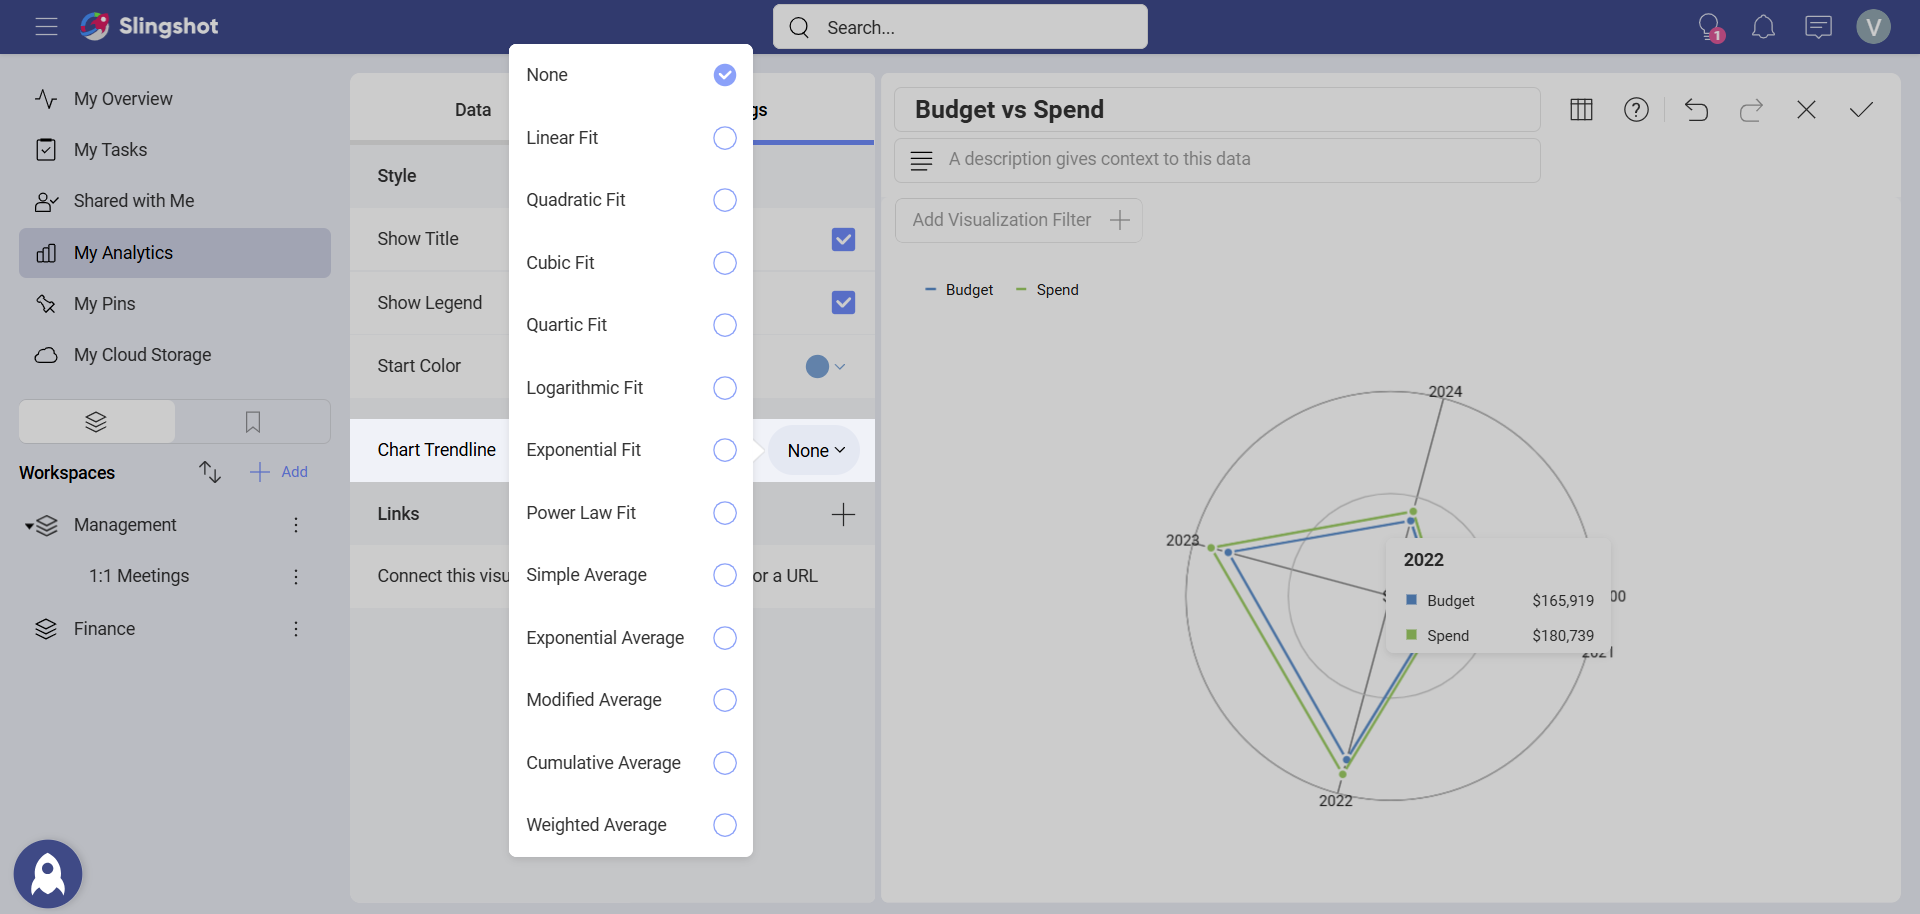
Chart Trendlines for Radial Charts
Chart settings enable the display of trend lines which are lines that are painted across a chart, based on an algorithm. Trendlines are a very simple, yet, powerful tool to help you determine trends in datasets and define thresholds for taking action. The supported algorithms are Linear Fit, Quadratic Fit, Cubic Fit, Quartic Fit, Logarithmic Fit, Exponential Fit, Power Law Fit, Simple Average, Exponential Average, Modified Average, Cumulative Average, Weighted Average.