Changing the Data Source for a Visualization
After visualizations are created, it is still possible to change their linked data sources. To do this:
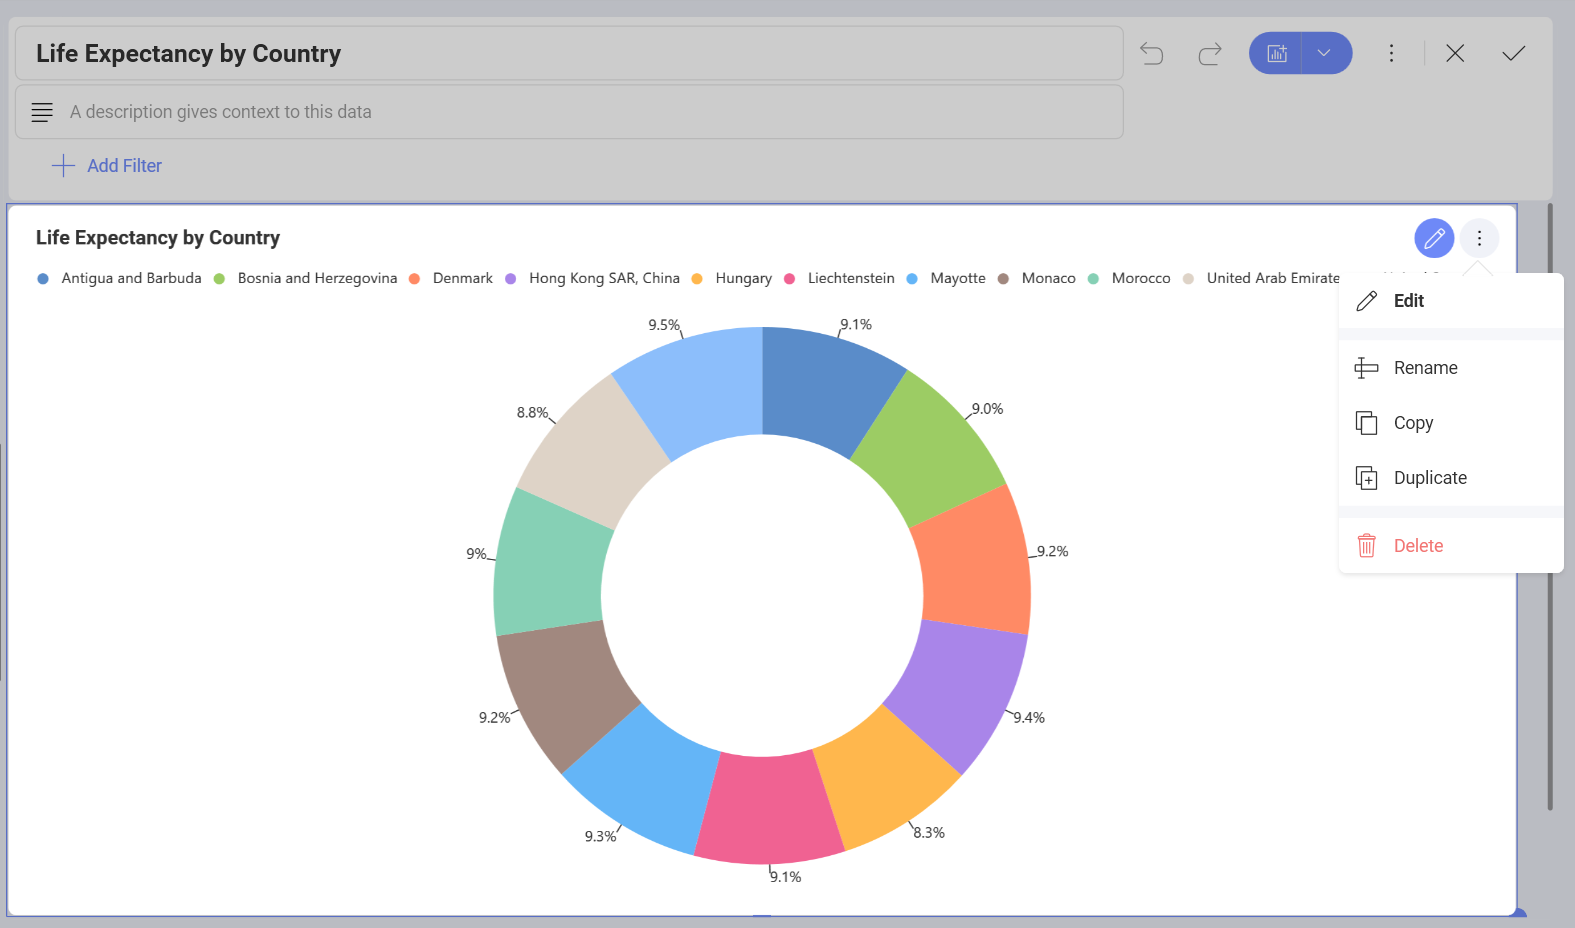
Access Dashboard Edit mode by selecting Edit from the overflow menu in the top right-hand corner. Alternatively, you can click/tap on the pencil icon.
Click/tap on Edit in the overflow menu of a chosen visualization.
- You will see your current data source listed in the Data section. In order to change it, select the overflow menu next to the data source name and click/tap on Edit.
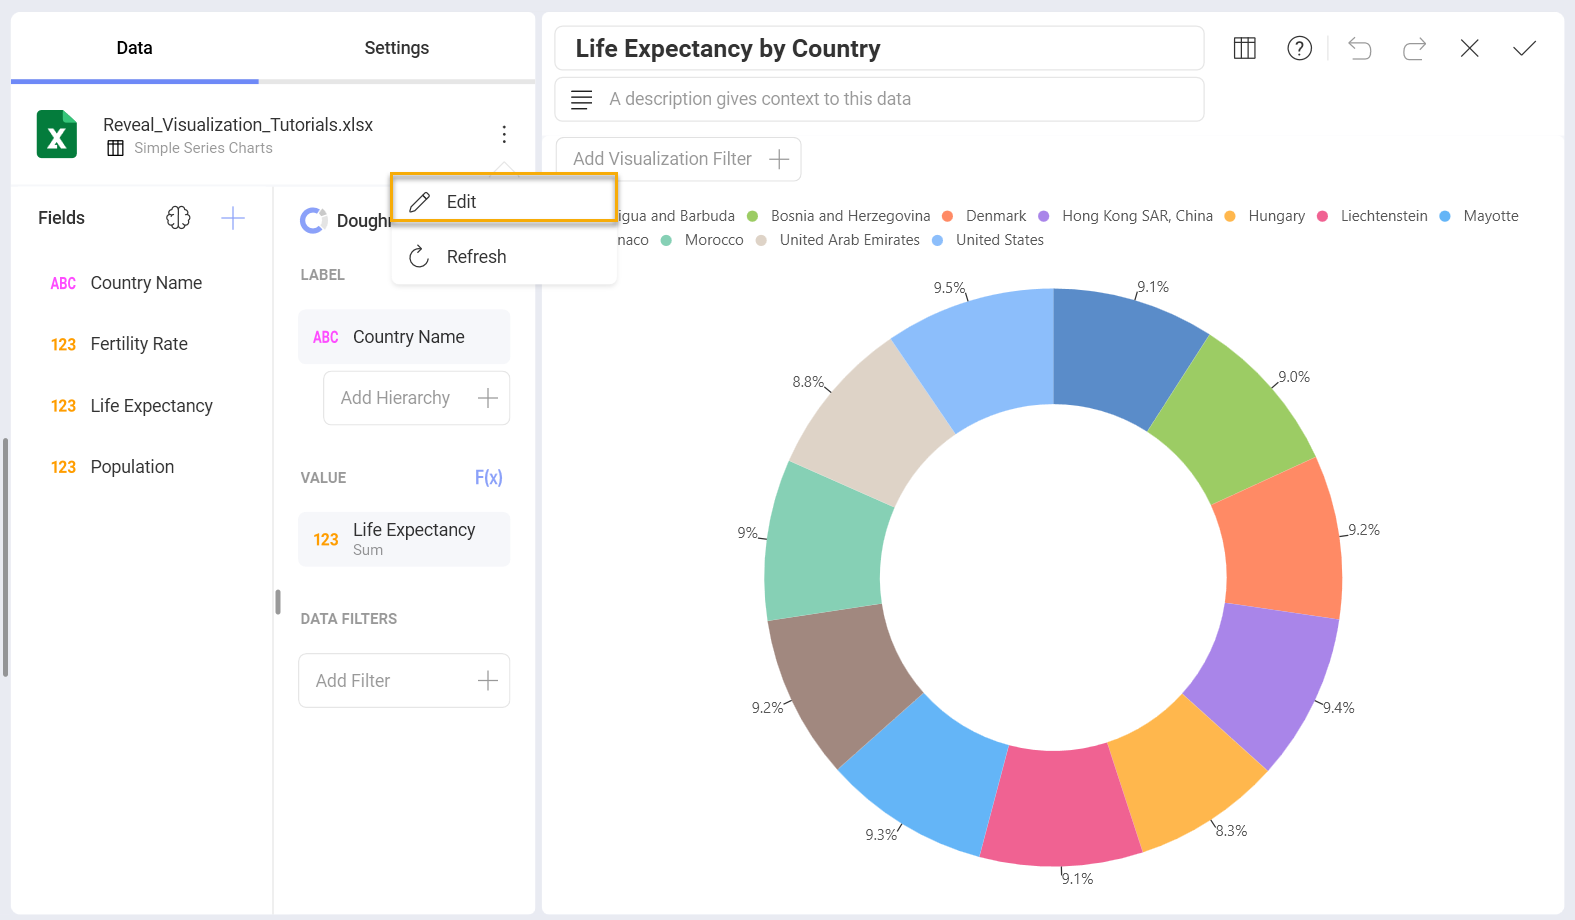
- This will display the Visualization Data, where you will see your current data source. You can choose another collection of data from the same data source or click/tap on Change data source next to your data source's name and choose a different data source.
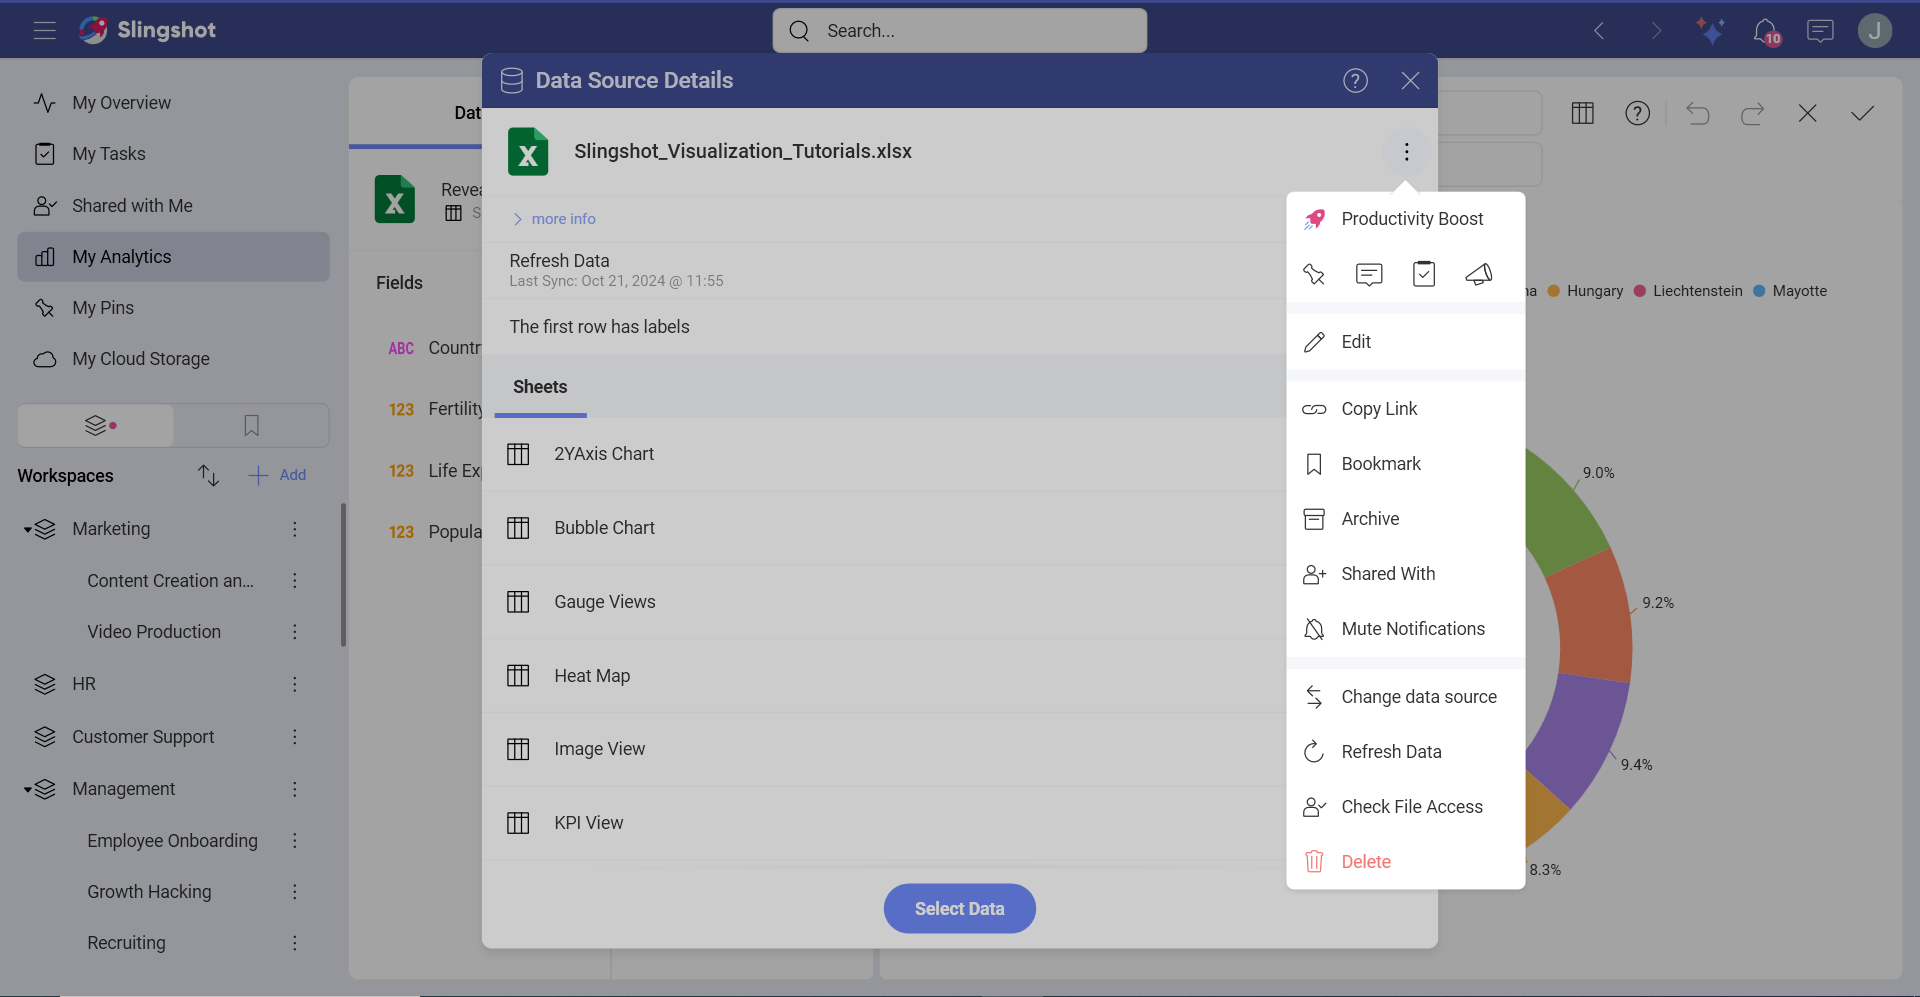
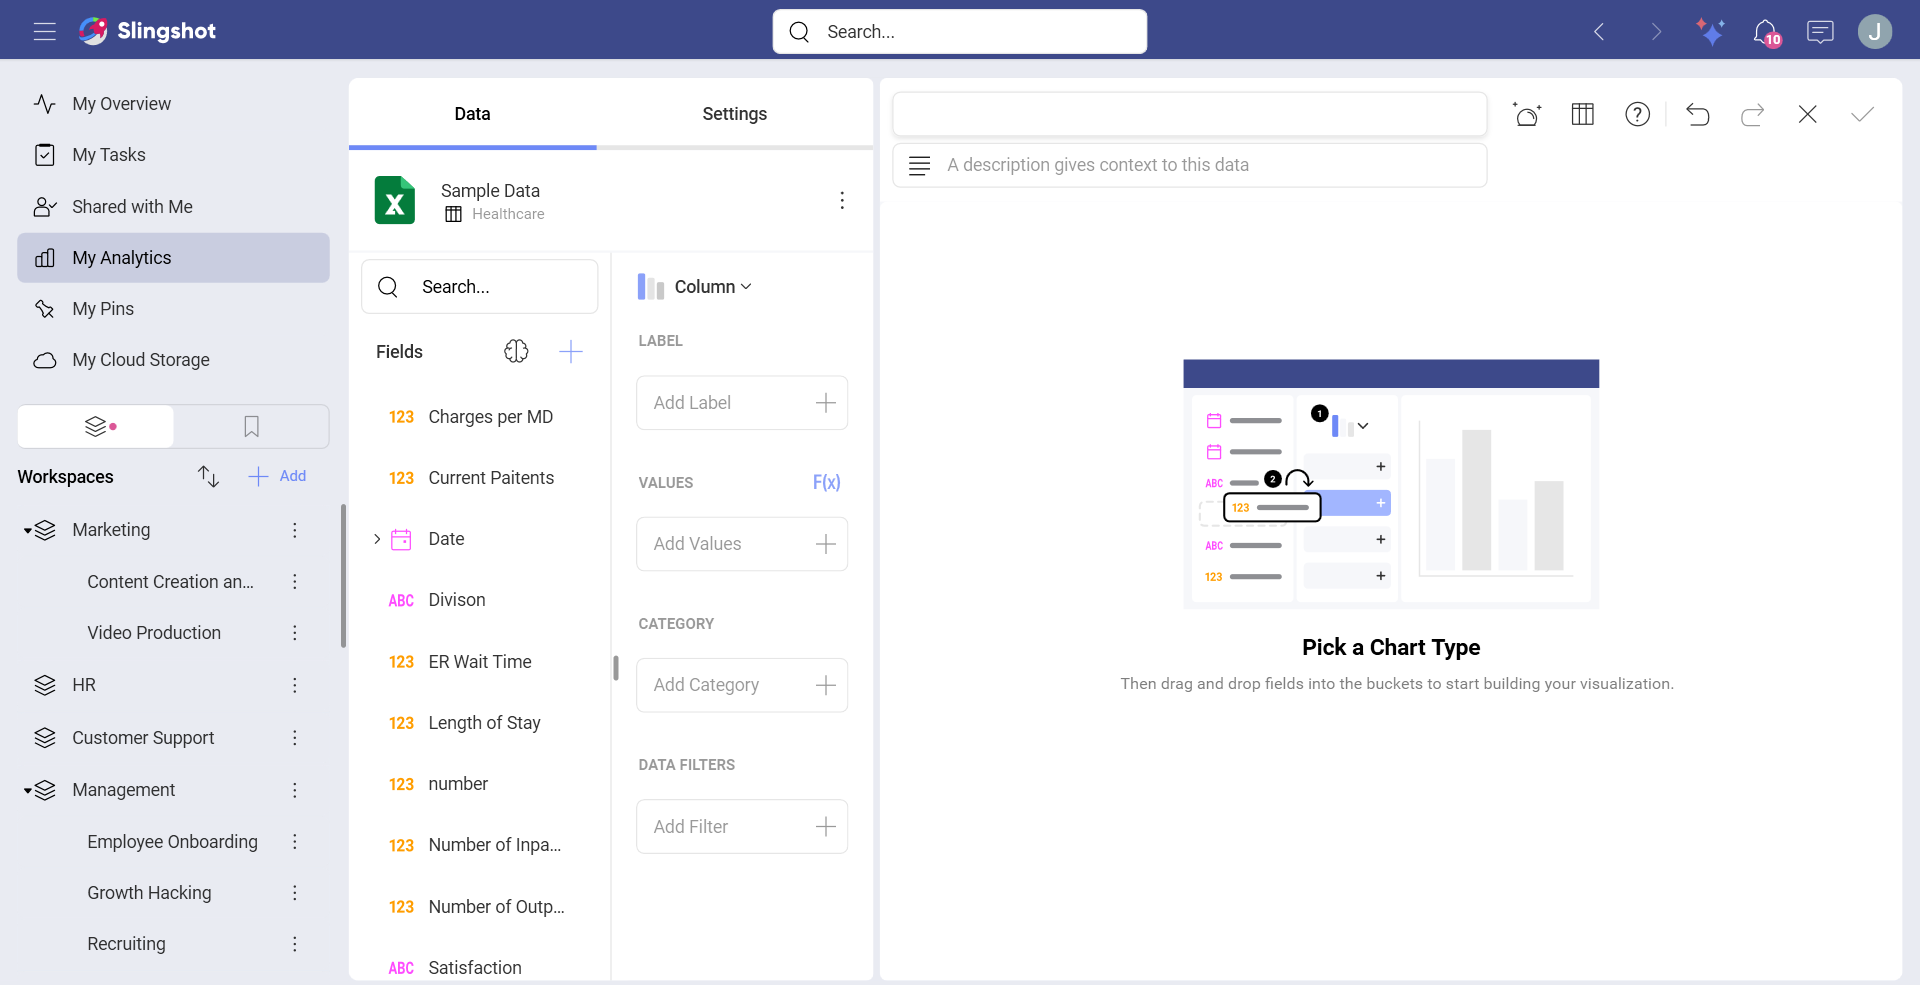
Once you have chosen the data source, a Data Source Details dialog will open up. Here you can select the information you want to use for the Visualization Editor. The data already present in the editor will be completely replaced by the data in your new data source.
You will see the name of the data source updated in the Data section of the Visualization Editor.