The Facebook data source connector in Analytics allows you to bring your Facebook marketing data to Slingshot. Use your Ad account data to create insightful dashboards and measure your business' social media performance.
Prerequisites
The Facebook data source connector will connect you to your Facebook Ad accounts data. Before you try using the Facebook data source in Analytics, make sure that:
You use a Facebook for Business account.
In the Ads Manager, you have added, requested or created an Ad account for the profile or Facebook page you want to connect.
The Ad account for the profile/page you want to connect is not deactivated. If you are not sure, use this Facebook help article to check and reactivate your Ad account if needed.
Adding a New Facebook Data Source Account
If you have already added your Facebook data source to the Data Sources list, you can skip this part and continue with Setting Up Your Data.
To add a Facebook data source to your list, follow the steps described below:
Click on the +Dashboard button under the My Analytics section.
Click on the +Data Source button.
Select Facebook that is under Social Media in the Data Sources list.
You will be prompted to log in with your Facebook profile.
[!NOTE] You need to have at least one Ad account associated with the Facebook profile you are trying to connect in Slingshot.
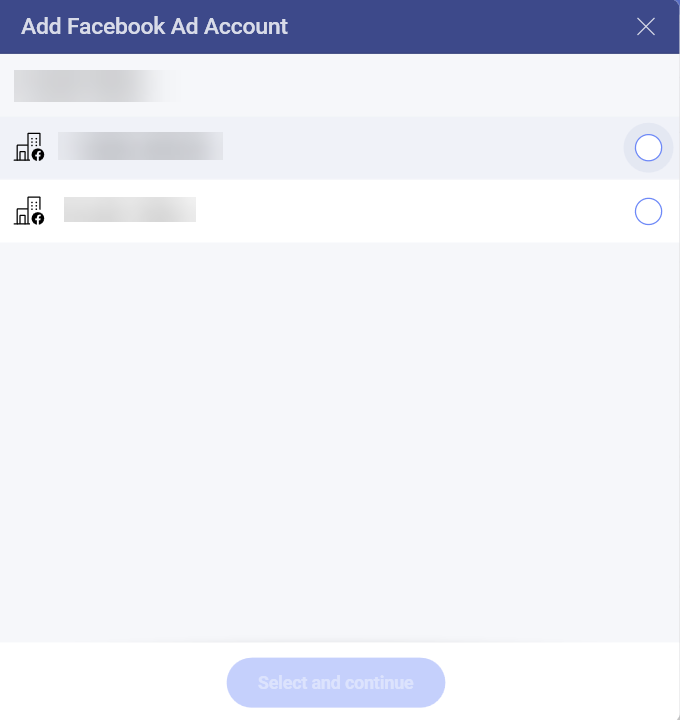
In the next dialog, you will be presented with one or more Facebook Ad Accounts to choose from. Select the account that you want to analyze and click/tap on Select and Continue.
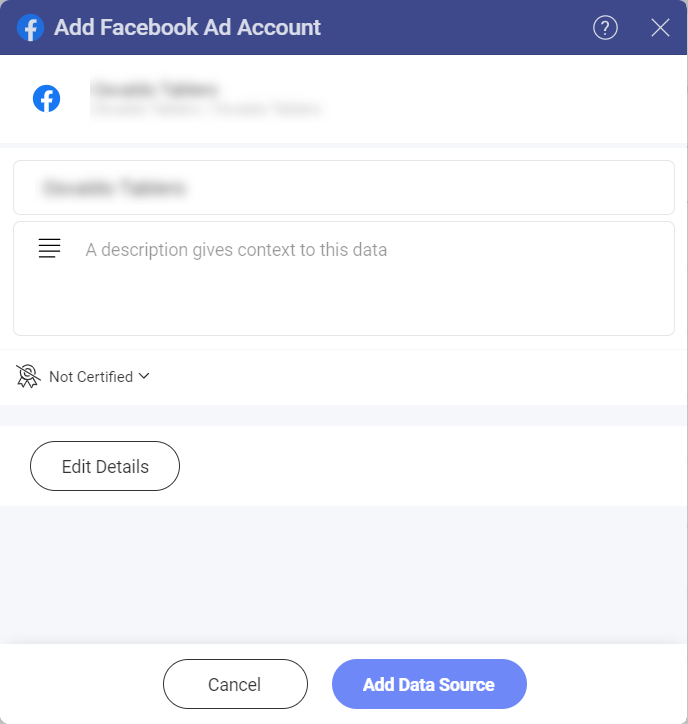
- In the last dialog that opens, you can change the Ad Account name, add an appropriate description, see if the data source is certified (available to Enterprise users), and edit the details. Adding appropriate descriptions helps all users navigate through long lists and find the data sources they are searching for. Select Add Data Source to finish the process.
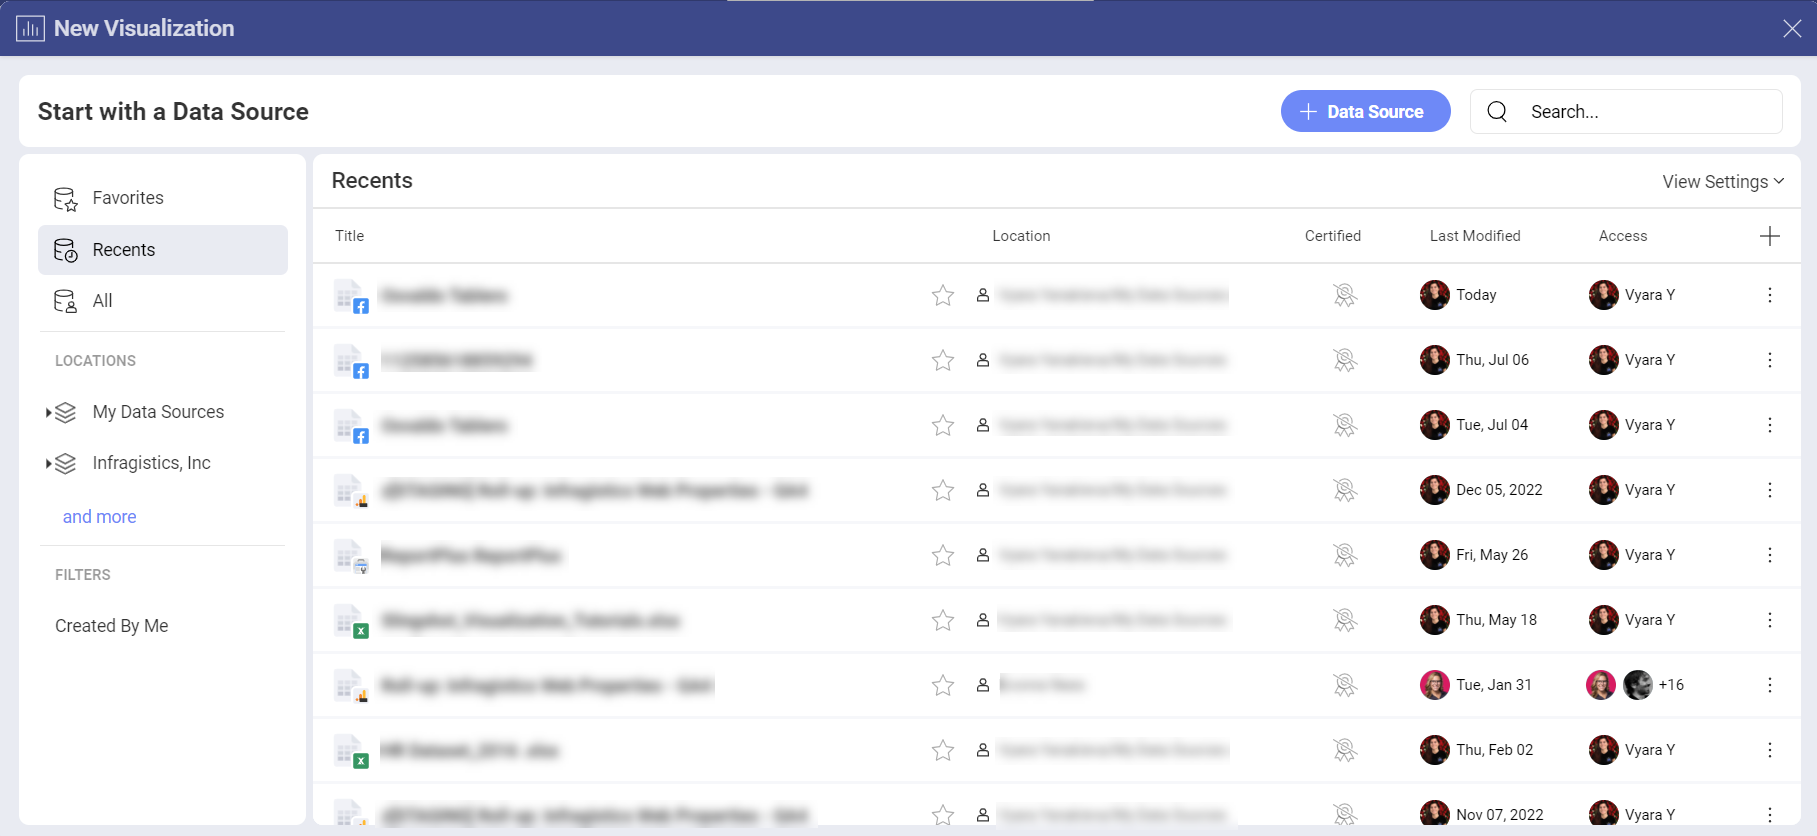
You will see your new Facebook Ad account connection added to your recently used Data Sources.
Setting Up Your Data
From the Data Sources list, select the Facebook Ad account you want to connect. You will see the Data Source details dialog, which allows you to review and set up your data (look at the screenshot below).
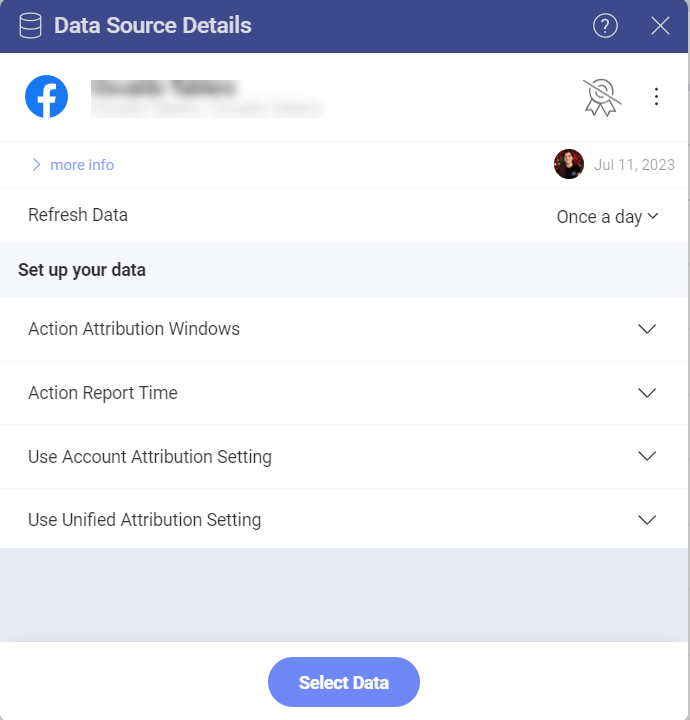
Here you will find the following data source details:
Type and Name
Description
Who added the data source and when
Who last modified it and when
Who (users and workspaces) has access to it
How often the data is refreshed. To change the time period, select the drop-down menu on the right.
The settings under Set up your data help you choose what data to load in the Visualization Editor.
Attribution Window - You can select it in order to show data for a specific time period from the drop-down list.
Action Report Time - You can choose it in order to have data reported on impression, on conversion and mixed.
Unified Attribution Setting
When ready, click/tap on Select Data to continue to the Visualization Editor.
Working in the Visualization Editor
Once your data source has been added, you will be taken to the Visualization Editor.
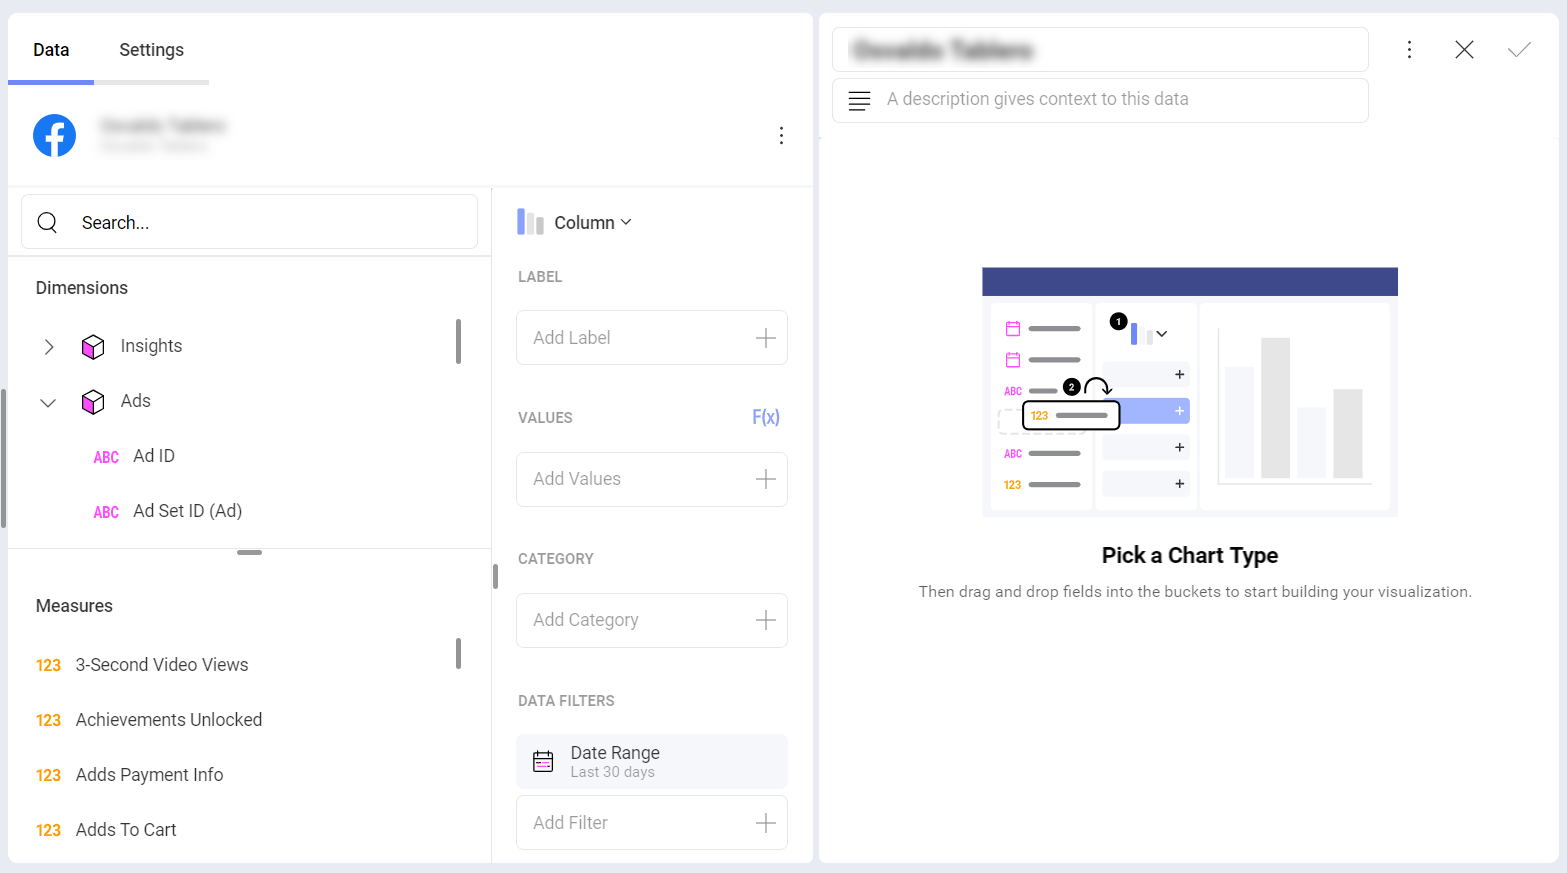
By default, the Column visualization will be selected. You can click/tap on it in order to choose another chart type from the drop-down menu.
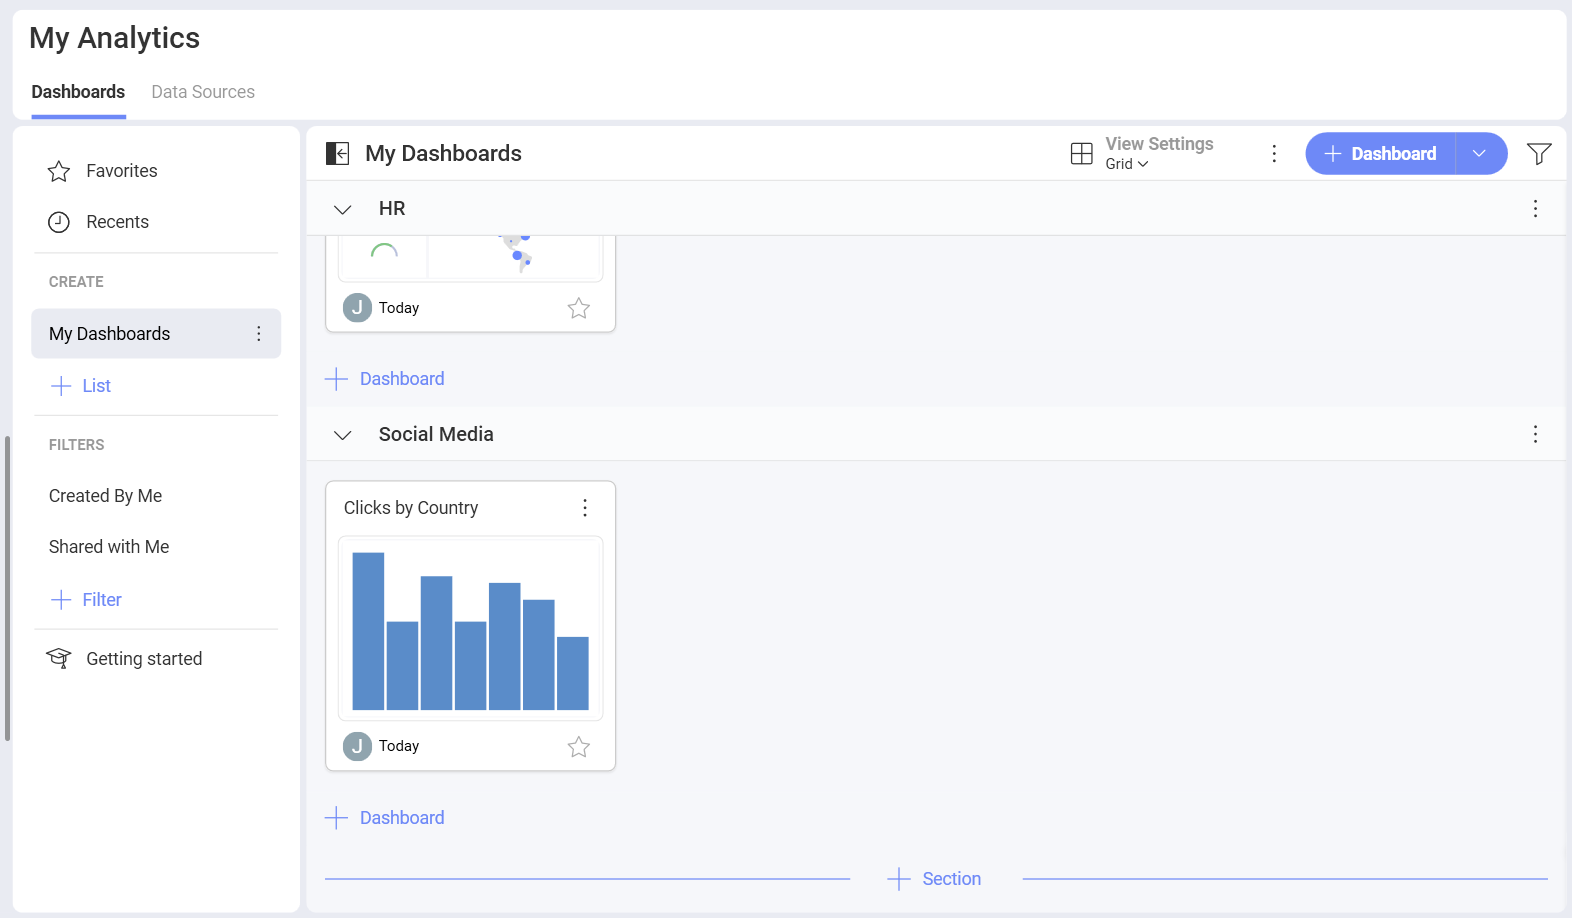
When you are ready with the visualization editor, you can save the dashboard in My Analytics ⇒ My Dashboards, a specific workspace or a project.
If you want to find more information about the data sources, you can head here.