Google Ads
The Google Ads data source allows you to access and analyze the data tables from your Google Ads (formerly Google Adwords) account. Create visualizations with your Google Ads data to build a high-level understanding of your advertising efforts.
Connecting to Google Ads
In order to connect your Google Ads account to Slingshot, you need to:
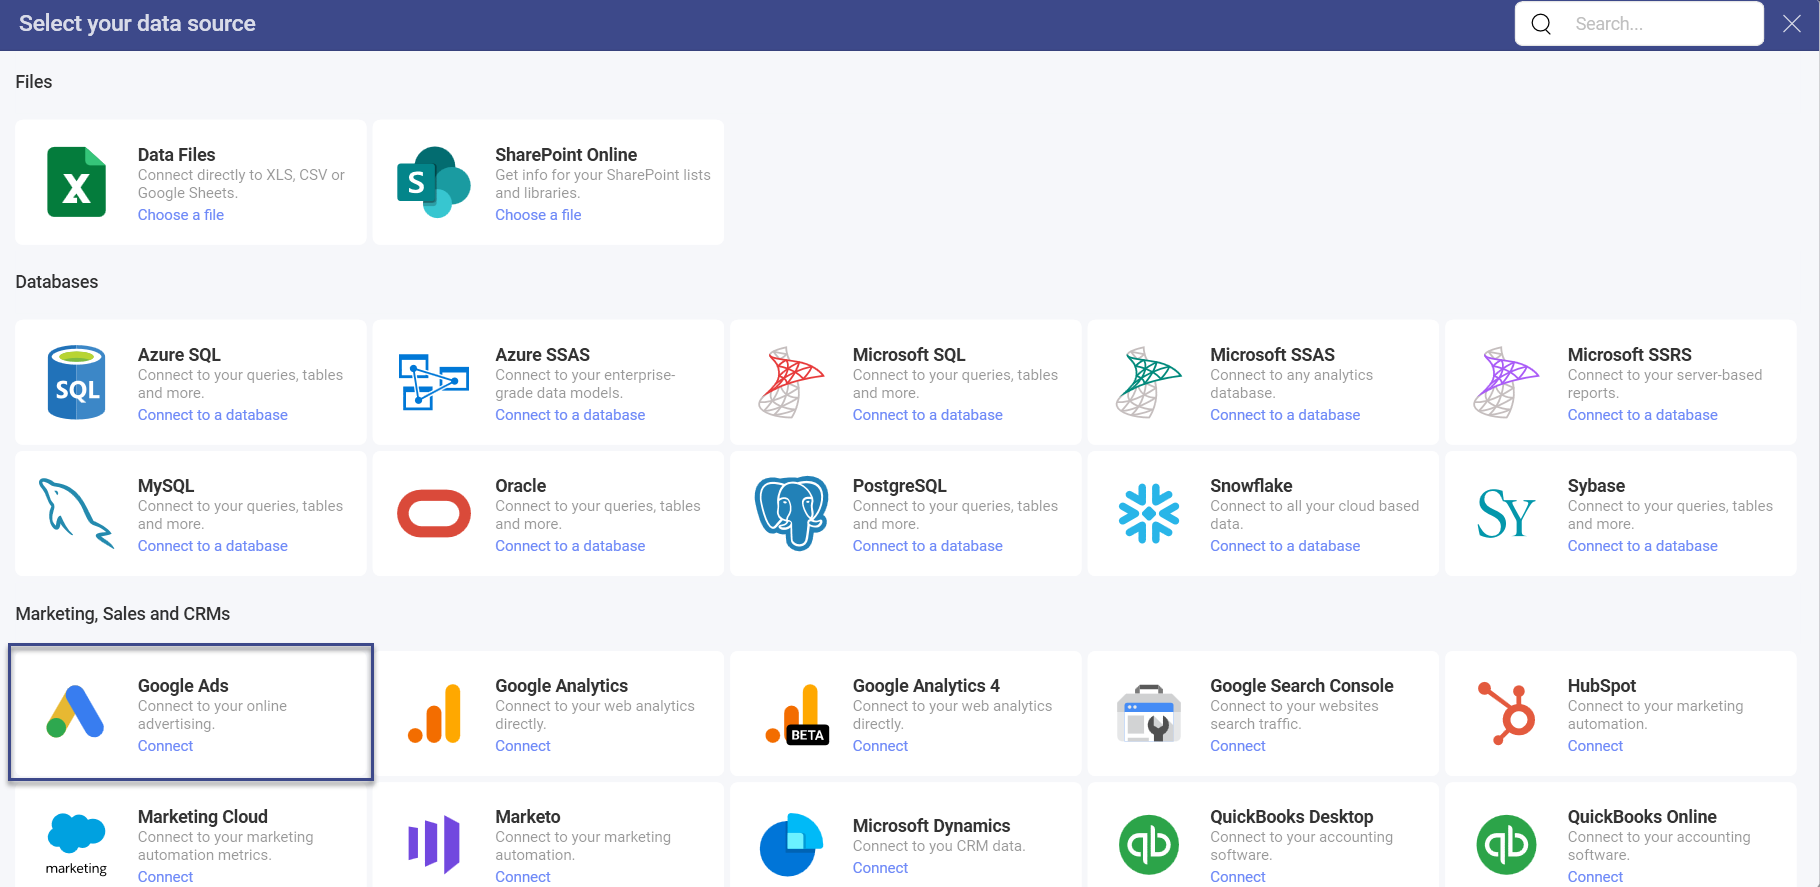
- Select Google Ads from the data sources list.
Google's login screen will pop up. If multiple Google accounts are listed, select the account that contains the Google Ads data you want to access.
Enter your login credentials, if you are not already signed in.
Select Allow in the authorization prompt.
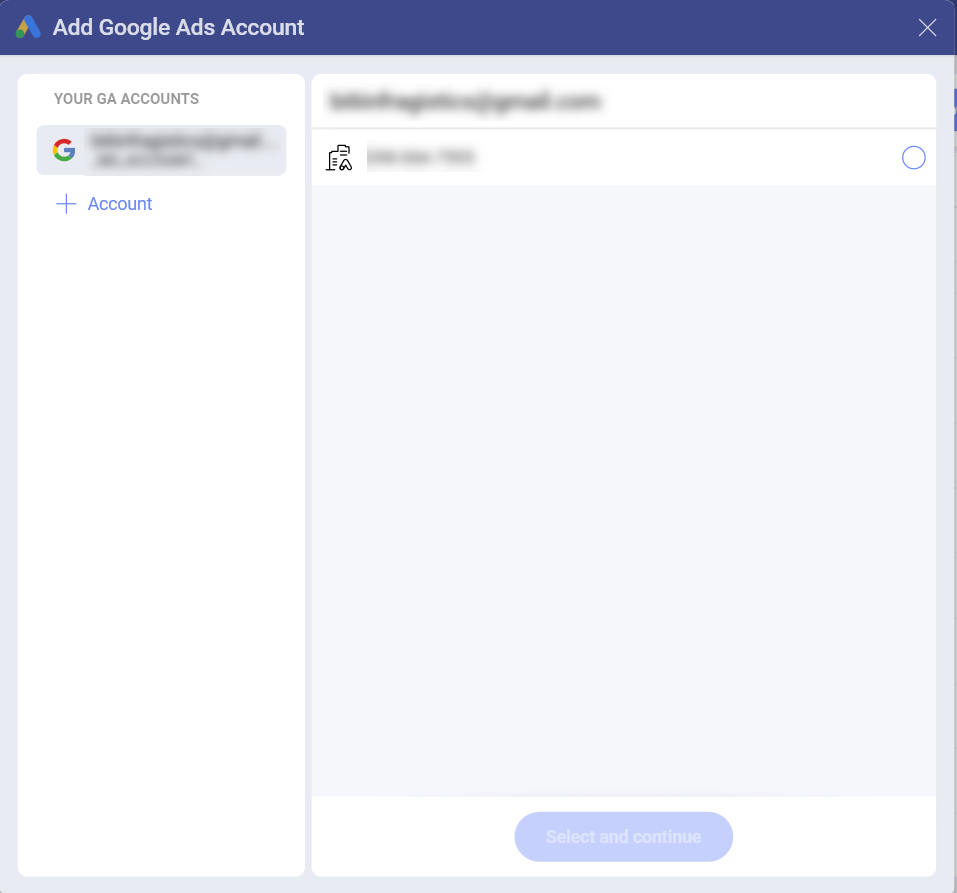
Choose a Google Ads account. If your Google account is connected to several Google Ads accounts, select the one you want to use in the following dialog.
- Choose a resource from one of the two lists: Popular Resources or All Resources. Use the search to find quickly what you need.
[!NOTE] Under each resource you will see a description. It gives information which dimensions from Google Ads are included in that specific resource.
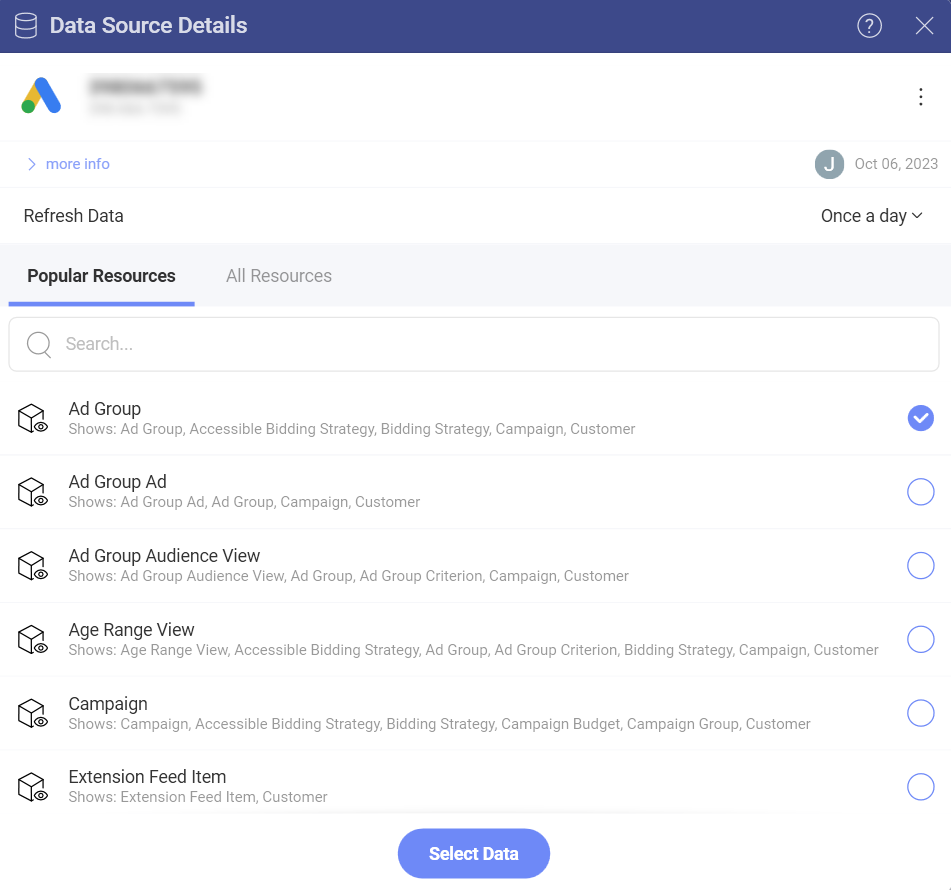
- When you are ready, click/tap on Select Data to continue to the Visualization Editor.
Working in the Visualization Editor
When you create a dashboard with information coming from Google Ads, you will see that fields in the Visualization Editor are organized differently (as shown in the screenshot below).
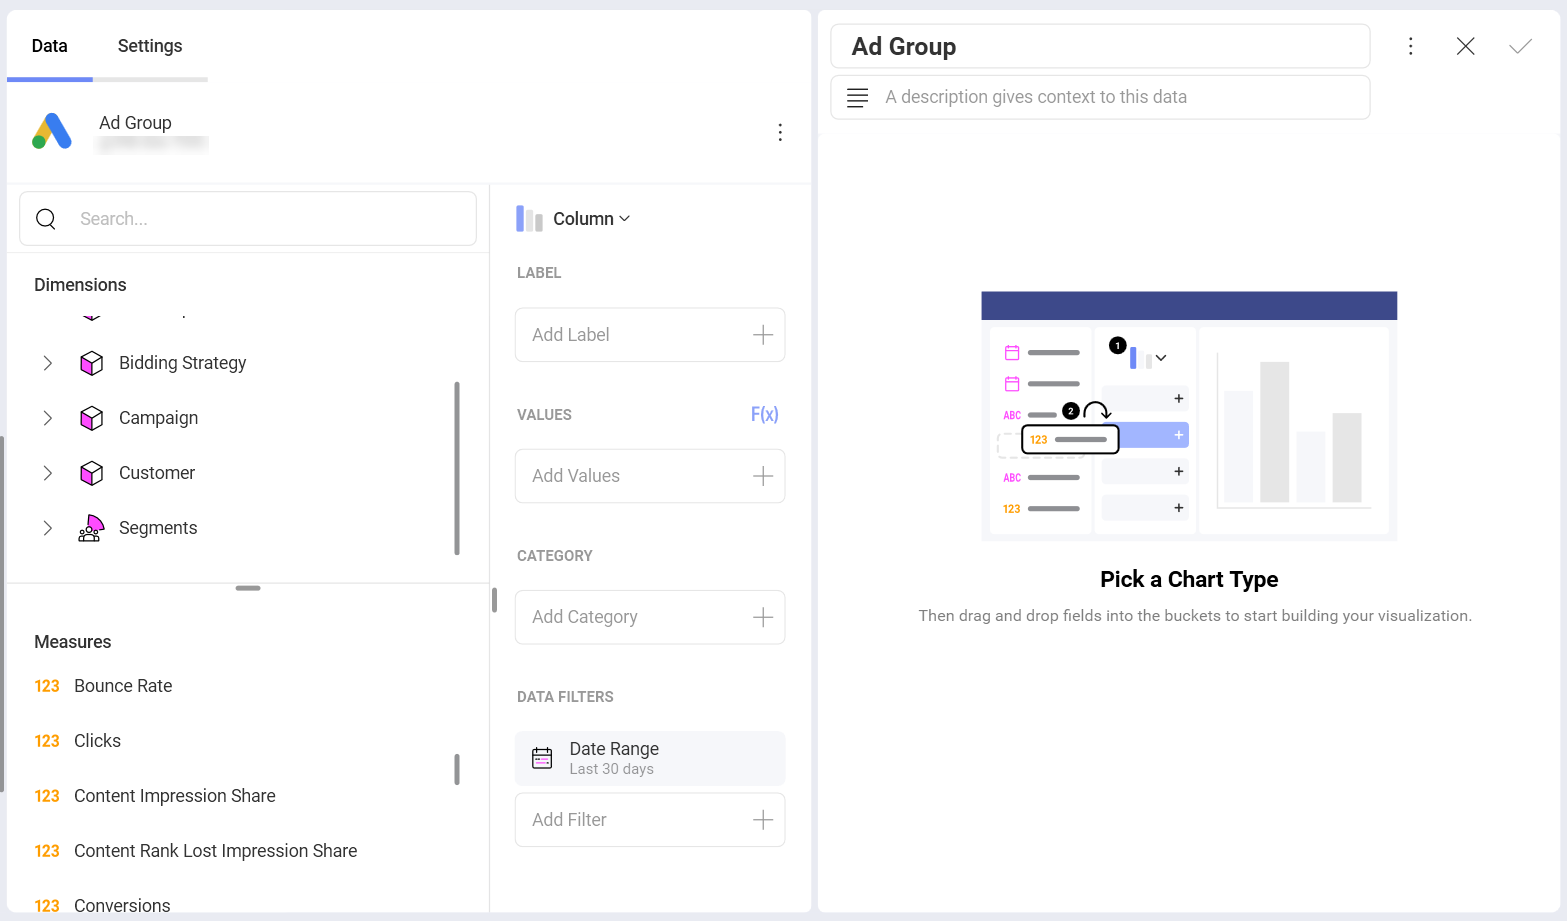
You may notice that there is no Fields heading on the left in the Data pane. Instead, there are two sections in their own query field:
Dimensions (also including Segments):
a. Dimensions are depicted by a cube icon with a pink side. Dimensions contain the attributes of data you can measure. For example, the dimension Name under the Ad Group cube will show all your ad groups.
b. Segments are depicted by one icon showing a group of people. Segments are different for each Google Ads resource you load in the Visualization Editor. In Slingshot, you can use Google Ads segments the same way you use dimensions - as measurable data or as data filters.
For more information on segments, consult the official Google Ads Help.Measures (depicted by a 123 icon): Measures consist of numeric data. For example, the measure Clicks shows the number of times ads were clicked.
The Date Range Data Filter
In Data Filters (see bottom right of the Data pane), you will find a date range filter set to Last 30 days by default. This means data will be retrieved for the last 30-day period, including today.
You can't remove the date filter, but you can change the default date range by clicking/tapping on the arrow in the upper right corner (see the screenshot) and pick a date range from the drop-down options.
[!NOTE] Data retrieved for Today. If you choose Today from the date range options, keep in mind the date range starts at 12:00:00 a.m. and all data will be retrieved up until the current time. This means that the results may vary between runs throughout the day as the data in Google Ads is being updated continuously.
Performance Considerations
Depending on how much data you are trying to retrieve, loading data from Google Ads in the Visualization Editor may become a time-consuming task. Certain actions affect waiting time more than others.
Selecting a Date Range
When selecting a date range, keep in mind that the bigger the range, the longer the time it takes to load your data. So, at first restrict your range, evaluate the loading time and then expand it appropriately.
If you are trying to load a dataset that is too large, you may receive an error stating you exceeded the rows/columns limits. If you can't restrict your time range enough to fit your purposes, then contact support for a limit increase.
Adding Segments
In Slingshot, you can combine multiple segments in the Visualization Editor. As segments are used for more detailed statistics, the more segments you add, the more rows of data you retrieve. This may affect loading time.