Google Analytics
Google Analytics is one of the most used web analytics services on the web, it tracks and reports website traffic. In addition, Google also provides an SDK to gather usage data from iOS and Android apps.
Connecting to Google Analytics
Log in
Select Google Analytics as your data source, and you will see Google's login screen.
Enter your login credentials and click/tap Sign In. You will then see an authorization prompt. You can click/tap on Allow.
Choose an account
If you have several Google Analytics accounts, select the one you want to use.
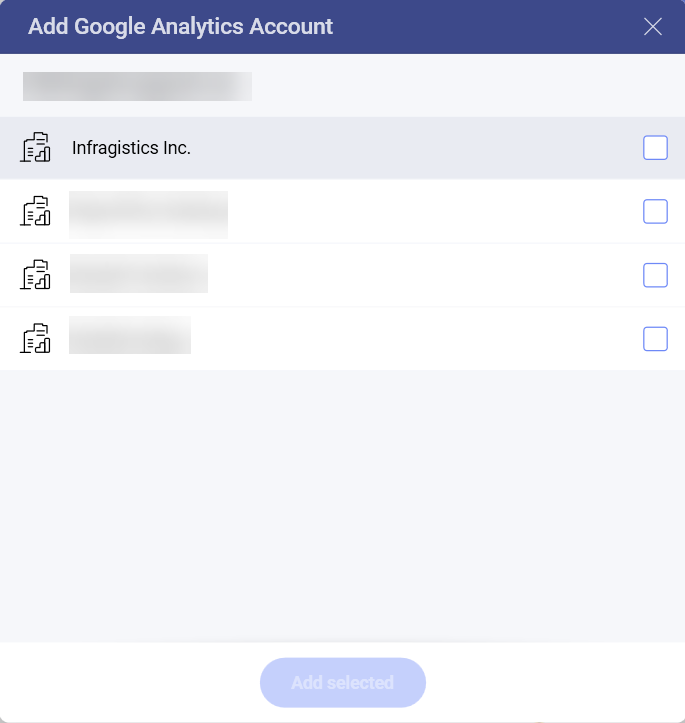
Once logged in, you can also use the same account later to create another visualization unless you delete the data source.
Choose a Property
Select the Google Analytics property that you want to use.
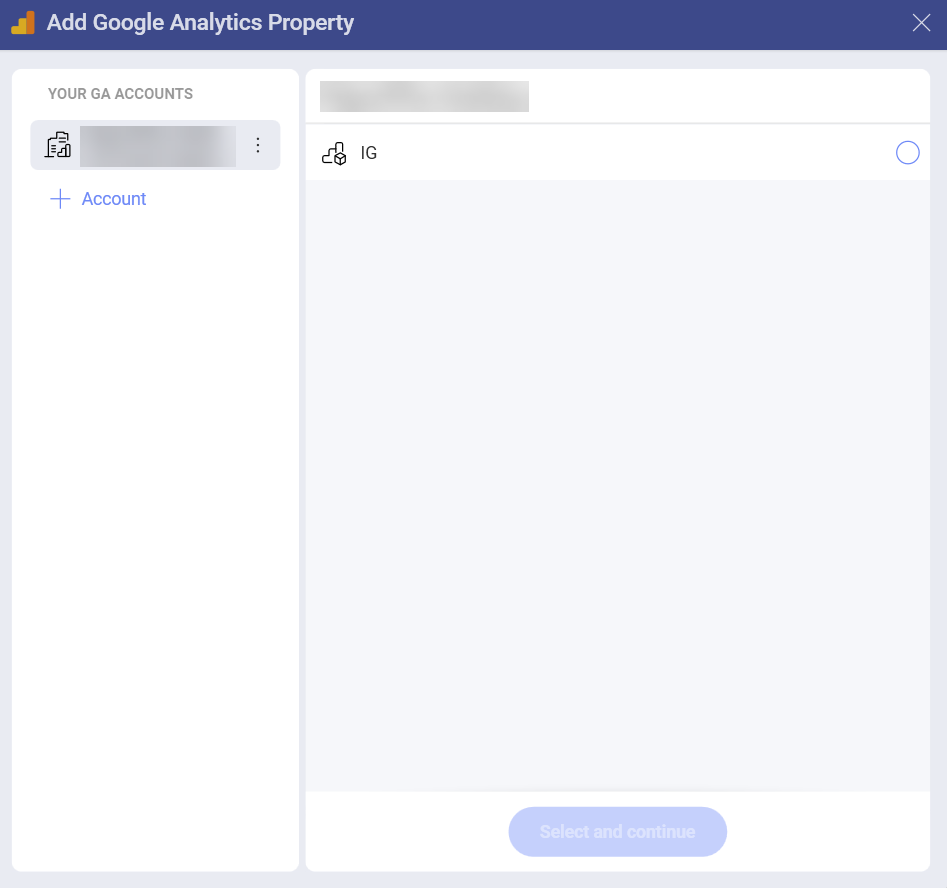
In Google Analytics, properties can be websites, mobile apps, blogs, among others.
Choose a database cube
Select the data cube that you want to use.
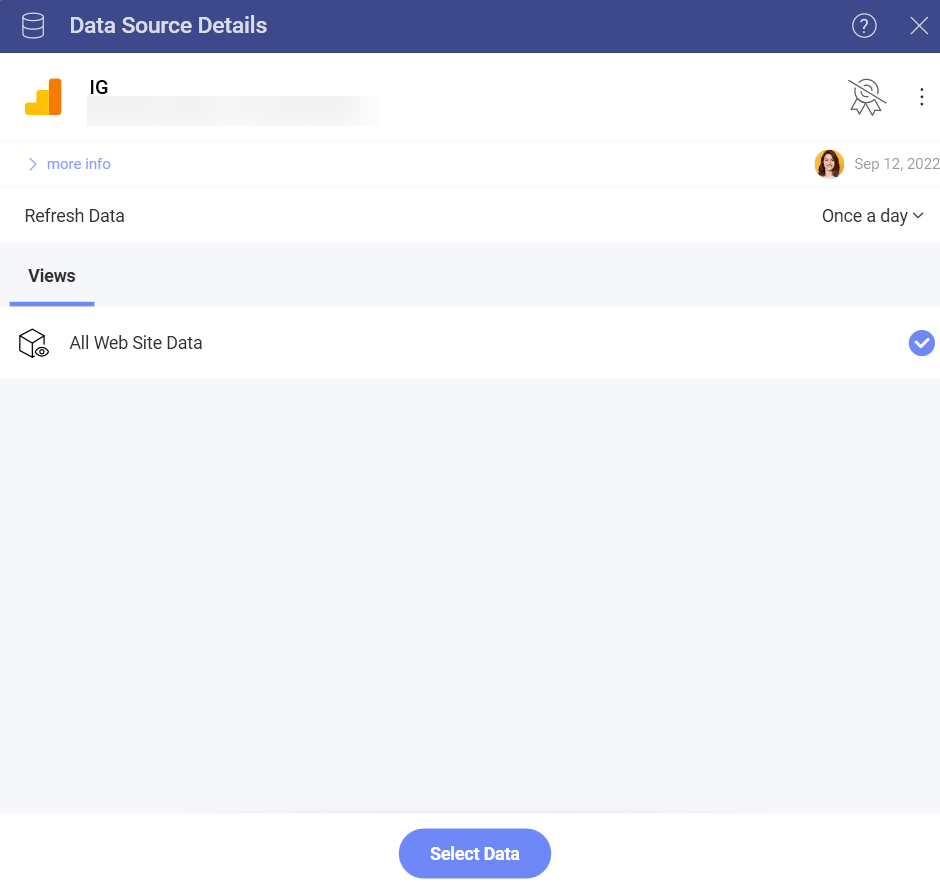
You can also configure the Refresh Data setting to the following values:
Always
Once an hour
Once a day
Once a week
After your credentials are verified, Analytics will take you to the Visualization Editor.
Working in the Visualization Editor
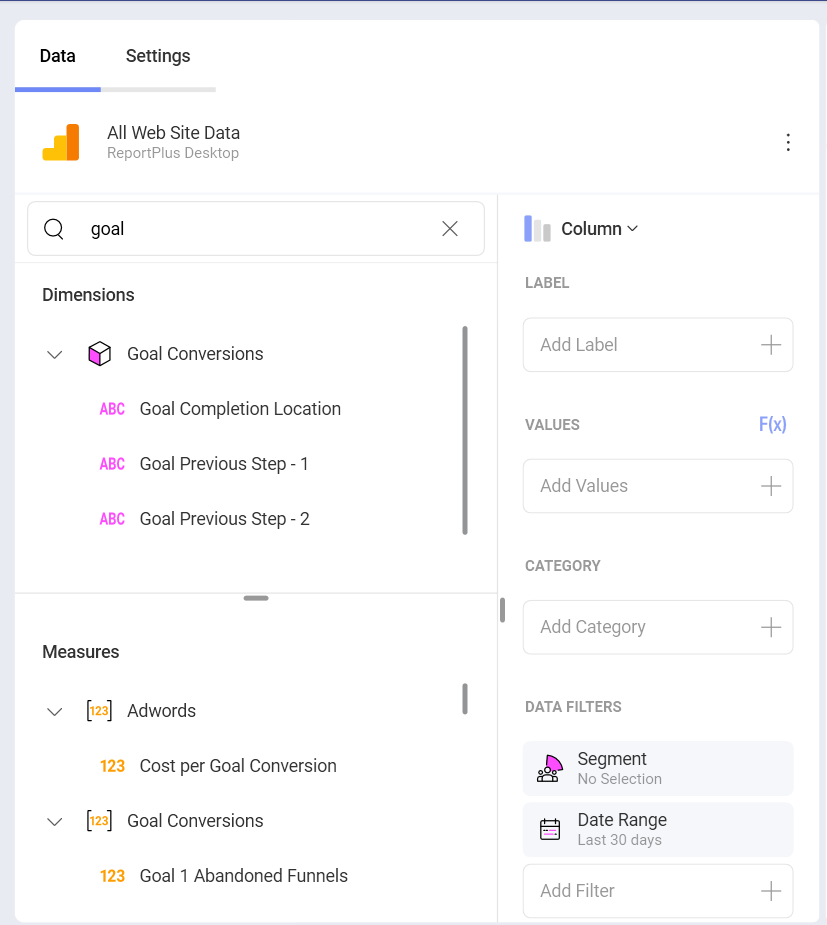
When you create a dashboard with information coming from Google Analytics, you will see fields organized differently (see screenshot below).
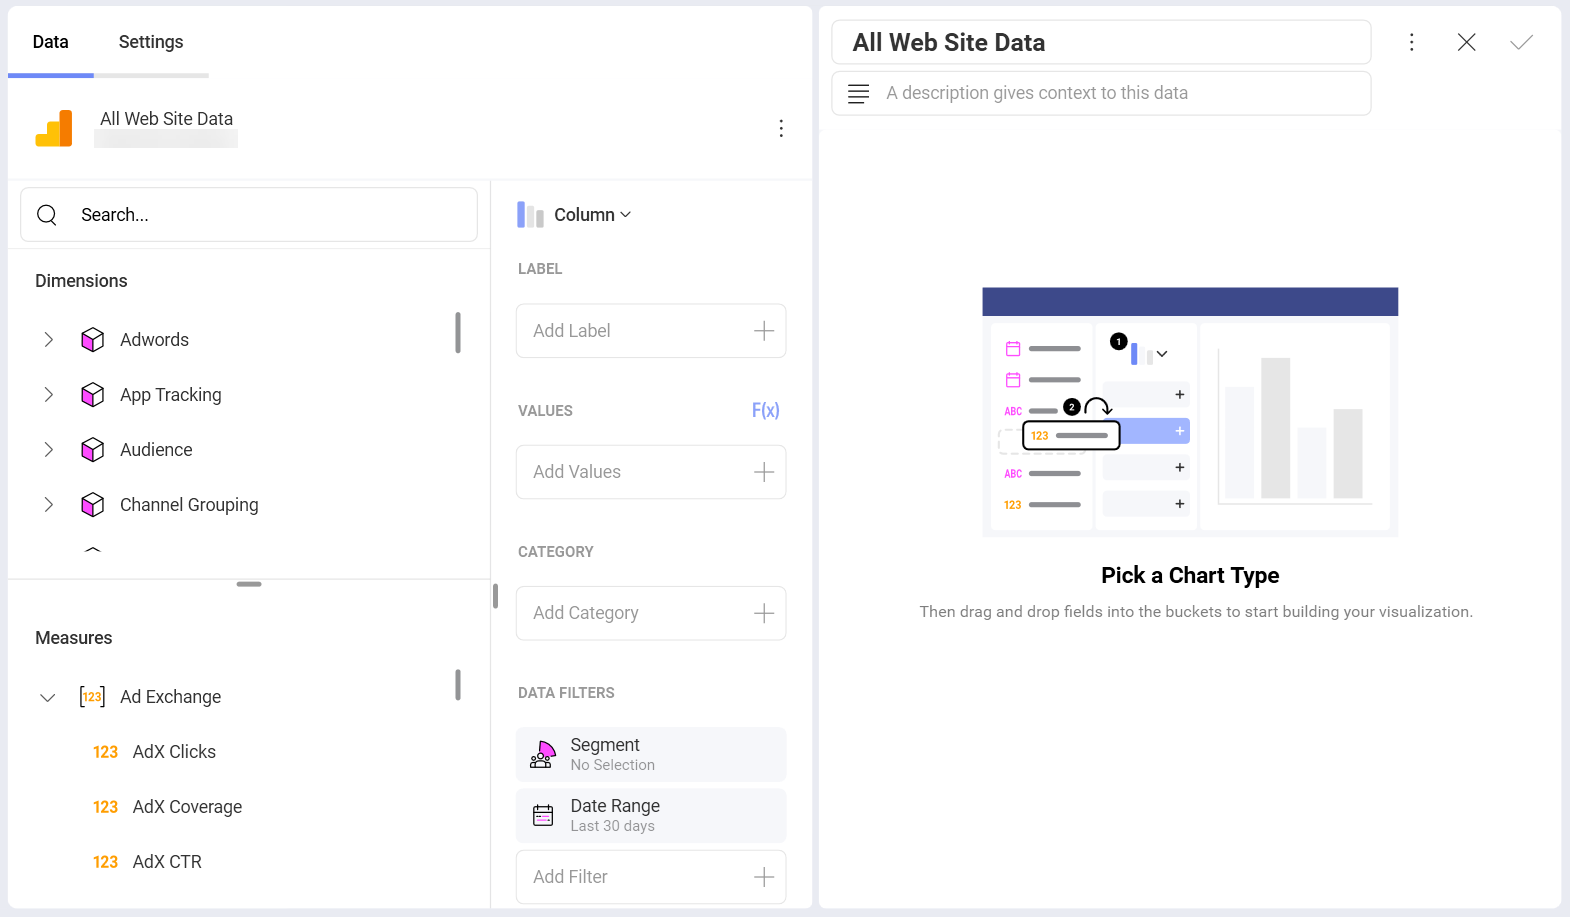
You may notice that there is no "Fields" heading on the left. Instead, there are two sections in their own query field:
Dimensions (depicted by a cube icon with a pink side): Dimensions are attributes of your data. For example, the dimension Gender (under the Audience cube) indicates the gender of your web site's audience.
Measures (depicted by 123 icon): Measures consist of numeric data. For example, the measure AdX Clicks is the number of times AdX ads were clicked on the site.
If you need to learn more, check this Google Analytics article: Dimensions and metrics.
Note
Some dimensions and measures cannot be used together. For a list of valid dimensions-measures combinations, refer to the Dimensions & Metrics Explorer on the Google Developer website.
Data Filters
There are two Data Filters when using the GA data source in Analytics.
Segment filter. The Segment filters are predefined. System Segments are defined by Google, and Custom Segments are defined by the user on the Google Analytics website. You can choose only one segment to filter your data.
Date Range. Select a specific date range in the calendar to filter your data. You can also choose one of the preset date ranges by clicking the arrow in the upper right corner:
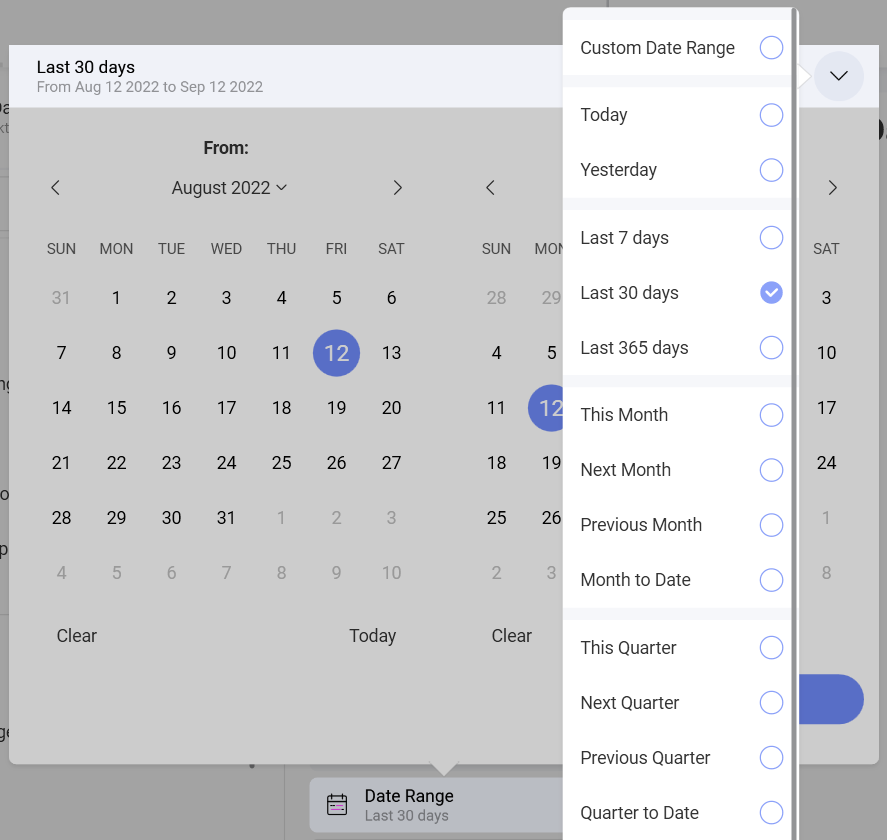
[!NOTE] Default date range is Last 30 days. This means data will be retrieved for the last 30-day period, including today.
Using Goals from Google Analytics
You can use Goals defined in Google Analytics in the Visualization Editor. Your Goals are listed as part of the metrics in both Dimensions and Measures data types.
As you can see in the example above, the titles of your Google Analytics Goals in Analytics include one or more of the following:
A numeric ID, from 1 to 20.
A label at the beginning - this is the name of the goal you configured for the specific goal, e.g. Completed Download for Goal 19.
A goal type at the end - e.g. Completions, Abandoned Funnels, etc.
For more information about Goals, please refer to this Google Analytics help page.