Google Analytics 4
Google Analytics 4 is one of the most used analytics services on the web. It tracks and reports website traffic. You can connect your Google Analytics 4 account to Slingshot in order to get clear and concise information with the help of different visualizations.
Connecting to Google Analytics 4
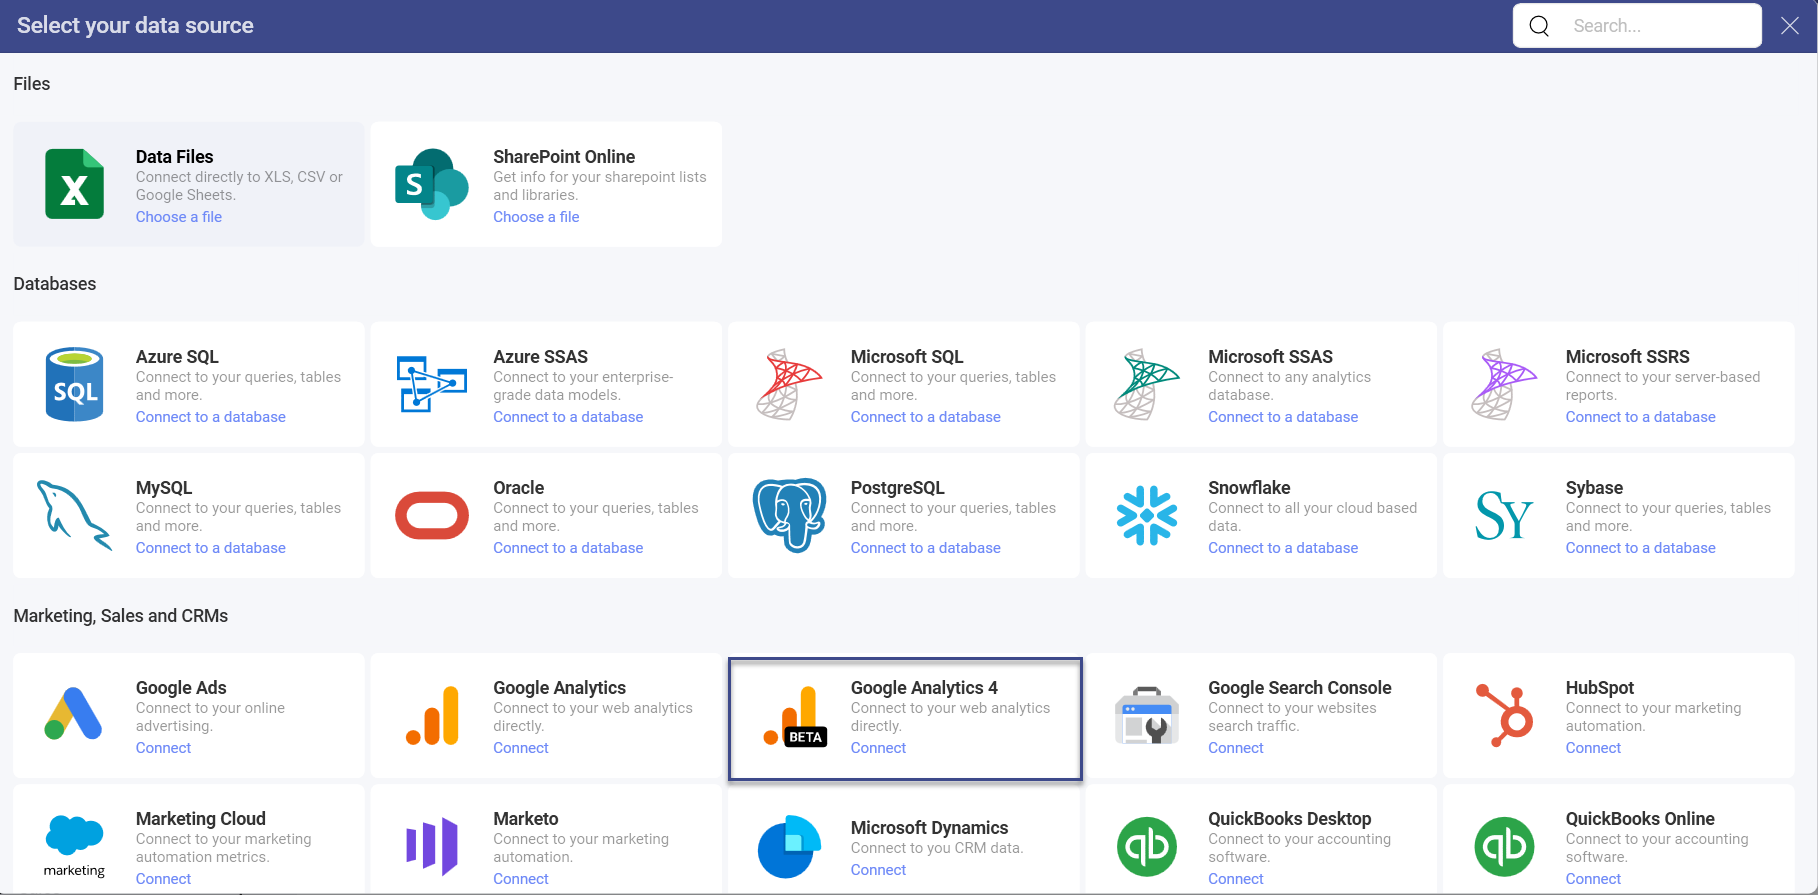
- Select Google Analytics 4 as your data source in order to see Google’s login screen.
Enter your login credentials and click/tap on Sign In. In case you see an authorization prompt, you can choose Allow.
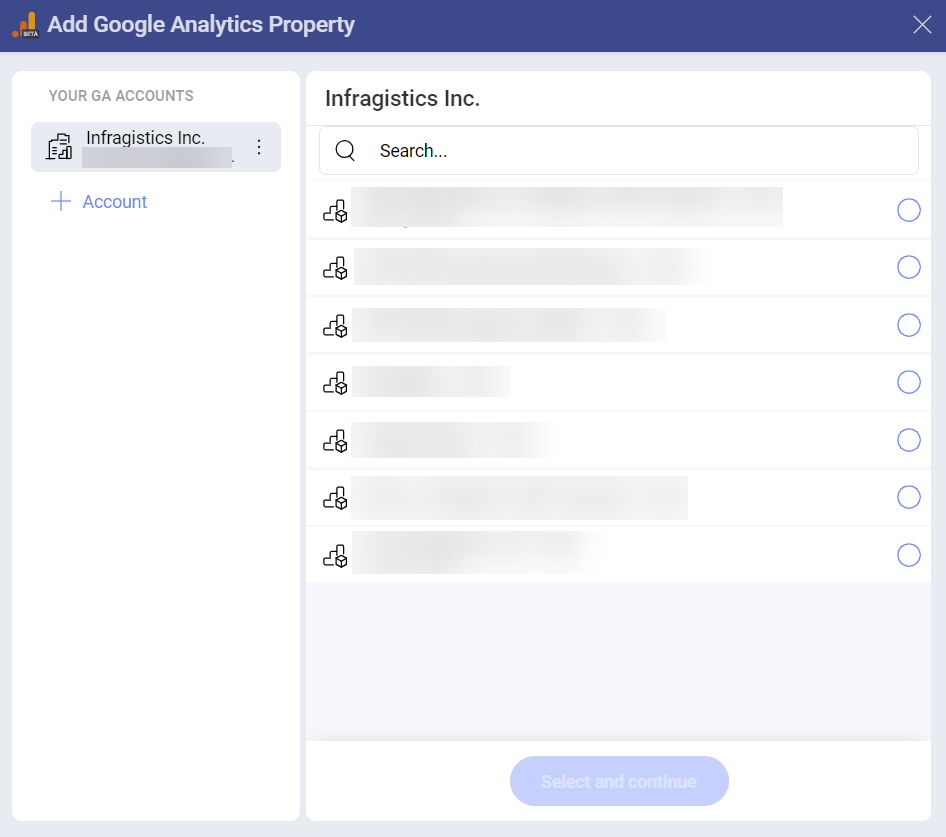
If you have several Google Analytics accounts, select the one you want to use.
Select the Google Analytics property that you want to use.
Working in the Visualization Editor
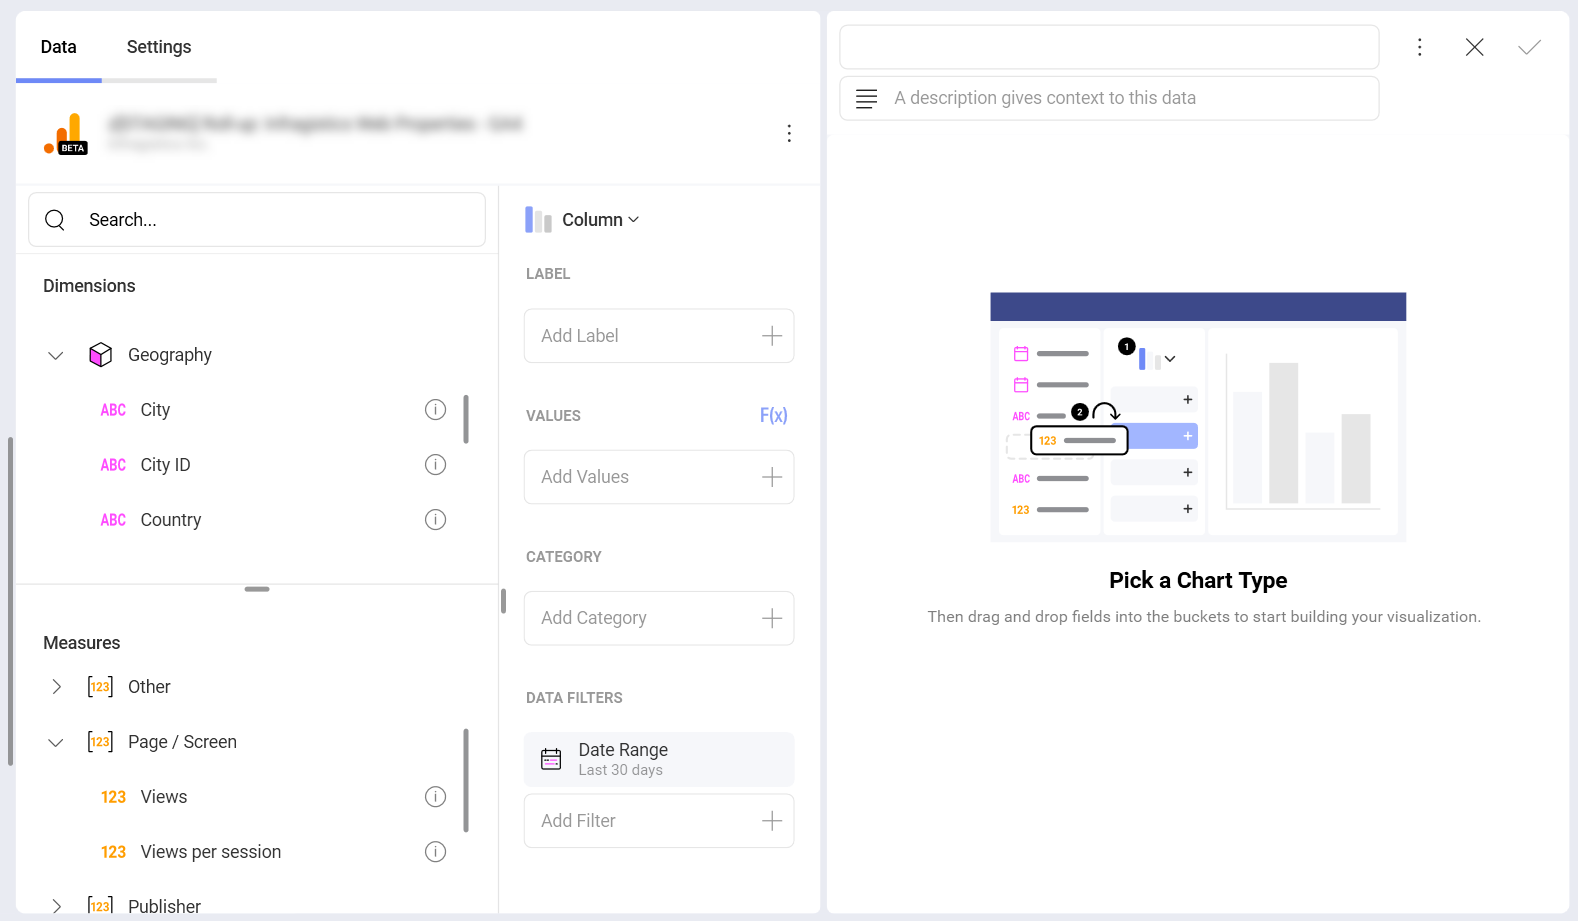
Once your data source has been added, you will be taken to the Visualization Editor. Here you can build your dashboard with the help of visualizations.
Note that the Column visualization is selected by default. You can click/tap on it in order to choose another chart type from the drop-down menu. You will see the data presented in two categories:
Dimensions (depicted by a cube icon with a pink side): Dimensions are attributes of your data. For example, the dimension Country (under Geography) shows where your website's audience comes from.
Measures (depicted by 123 icon): Measures consist of numeric data. For example, the measure Views (under Page/Screen) indicates the number of views for a certain period of time.
To learn more about dimensions and metrics, you can check this article.
Some dimensions and measures cannot be used together. For a list of valid dimensions-measures combinations, you can refer to the Dimensions & Metrics Explorer on the Google Developer website.
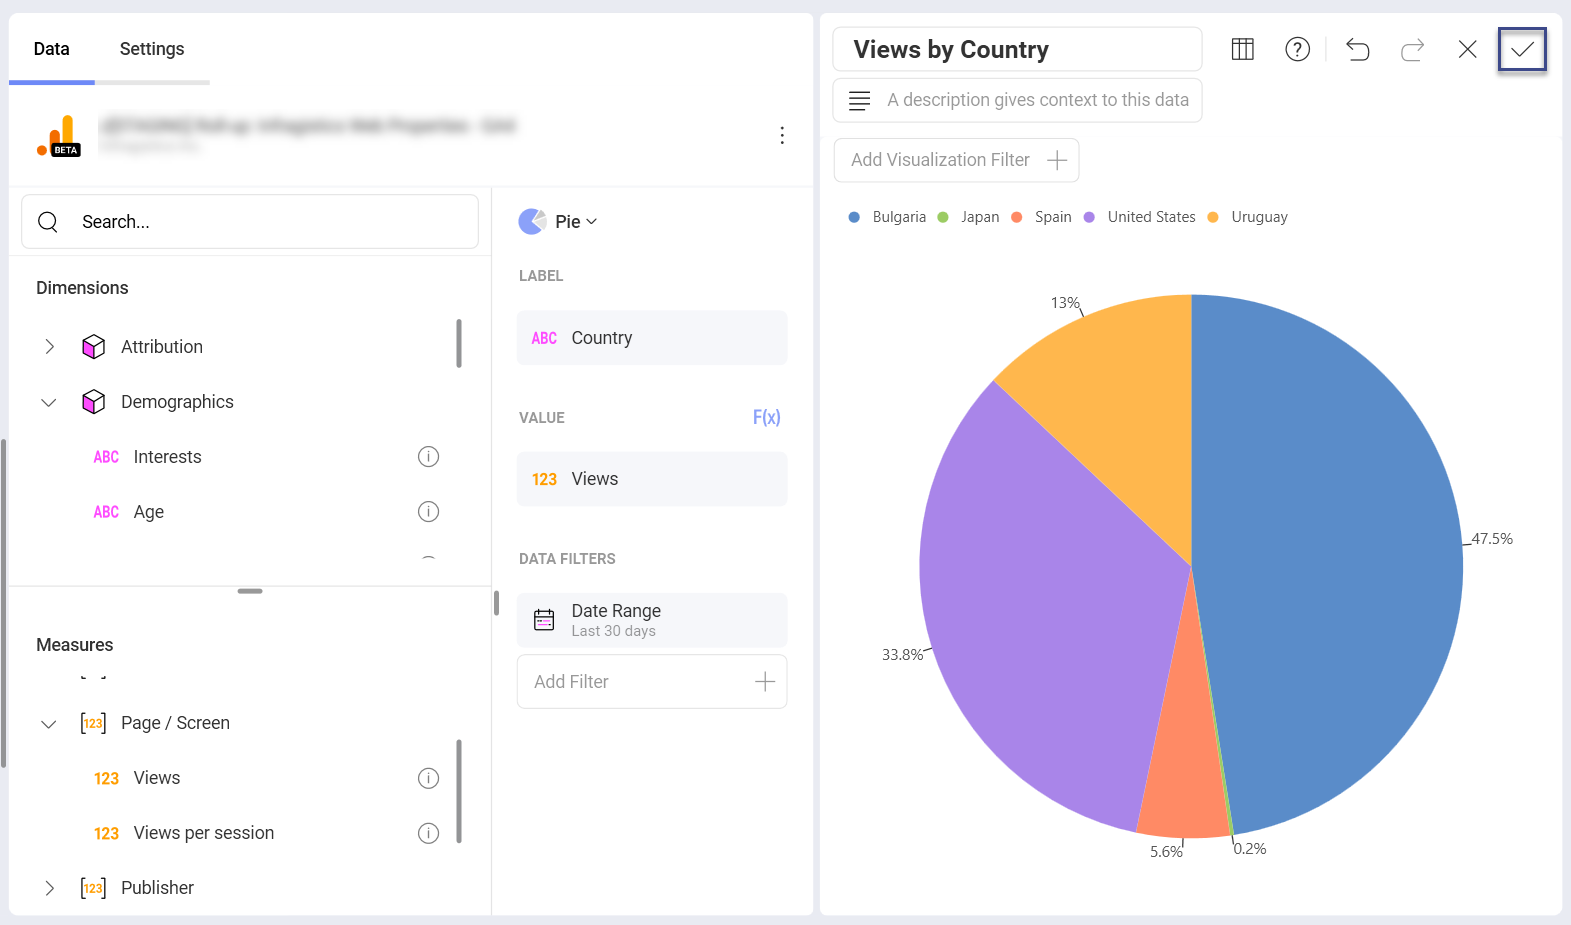
When you are ready with your visualization, you can save it as a dashboard by clicking/tapping on the checkmark in the top right corner.
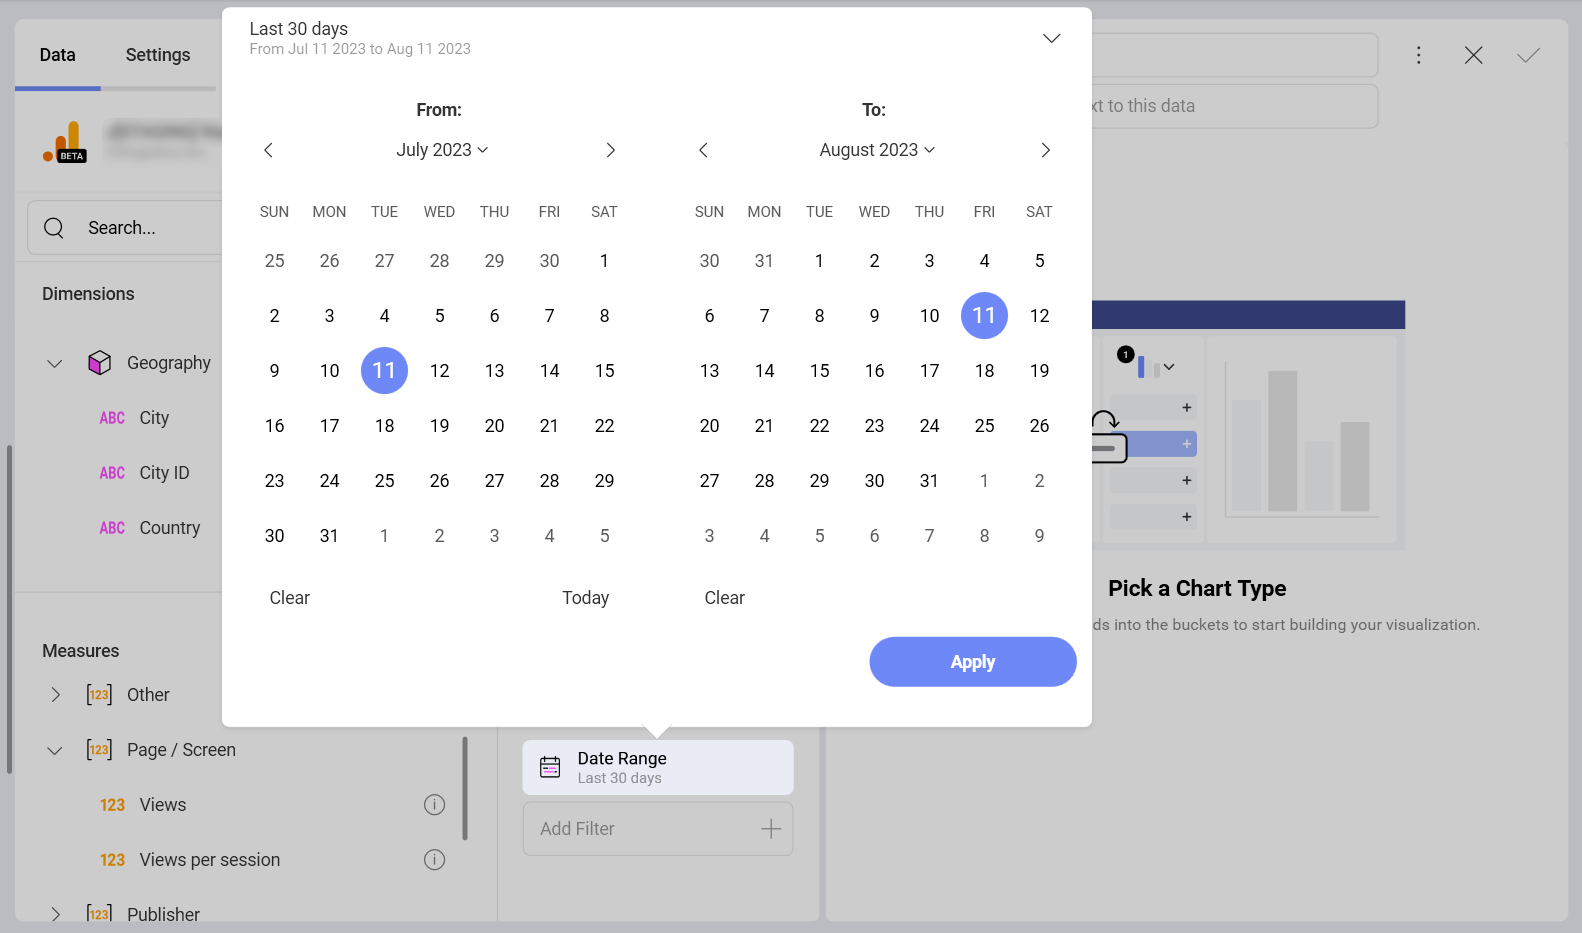
Date Range Data Filter
You can filter your data by selecting a specific data range in the calendar. You can also choose one of the preset date ranges by clicking/tapping on the arrow in the upper right corner:
If you want to find out more information about the different data sources, you can head here.