Google BigQuery
The Google BigQuery data source provides a significant speed increase when processing big data within Analytics. This allows you to use datasets with millions of records for your visualizations with no slow down.
Connecting to Google BigQuery
Upon selecting Google BigQuery, you will be prompted to connect to your Google account.
Once you've added a Google account, you will have access to your BigQuery datasets. To start using them for your visualizations, you need to:
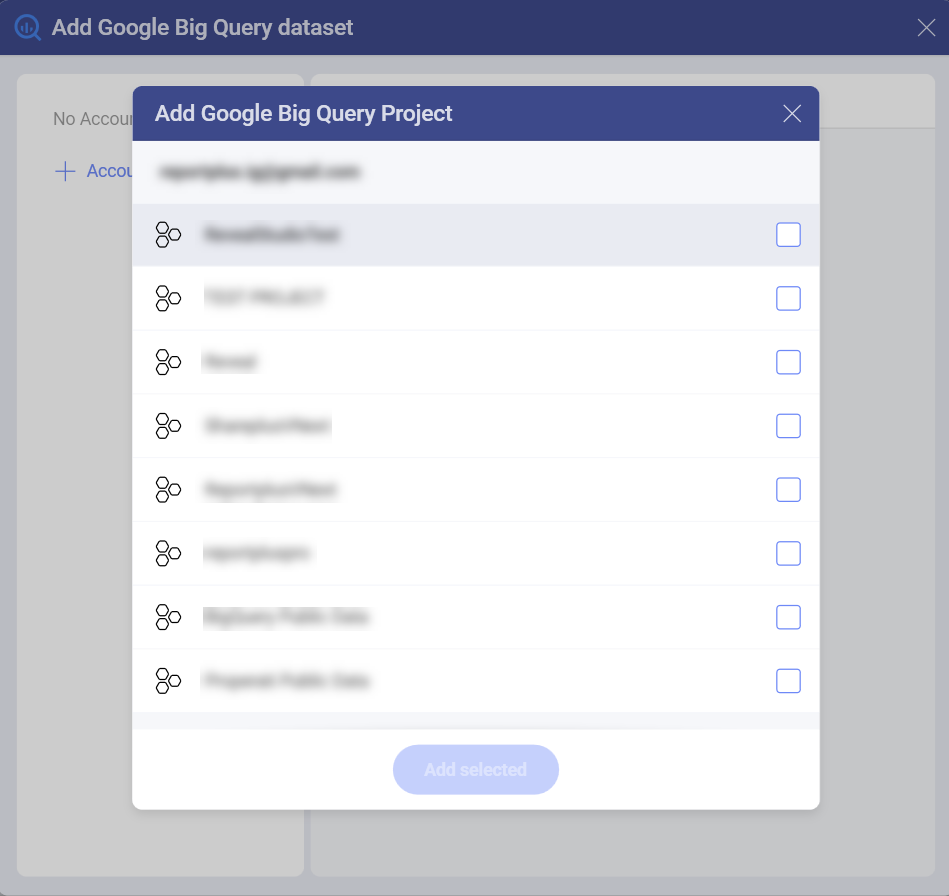
Select a project in the New Data Source dialog that opens up:
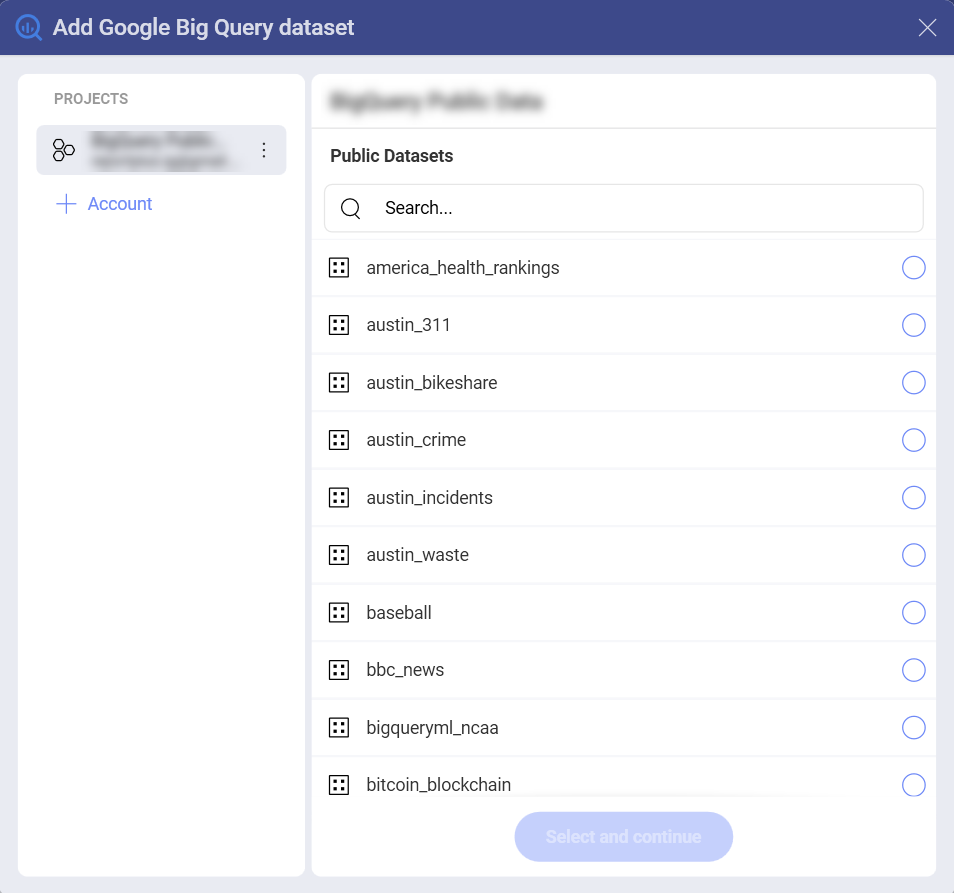
Select a dataset by marking the empty circle next to it:
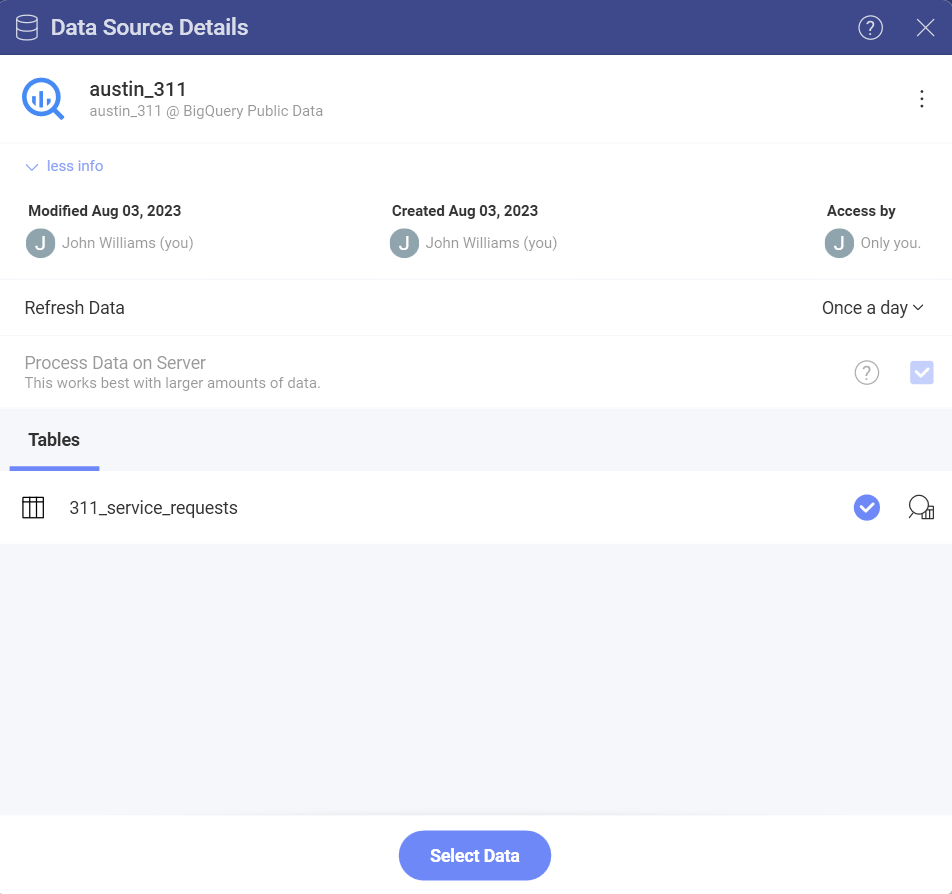
Select a table from the dataset. Use the magnifying glass icon on the right to preview the data.
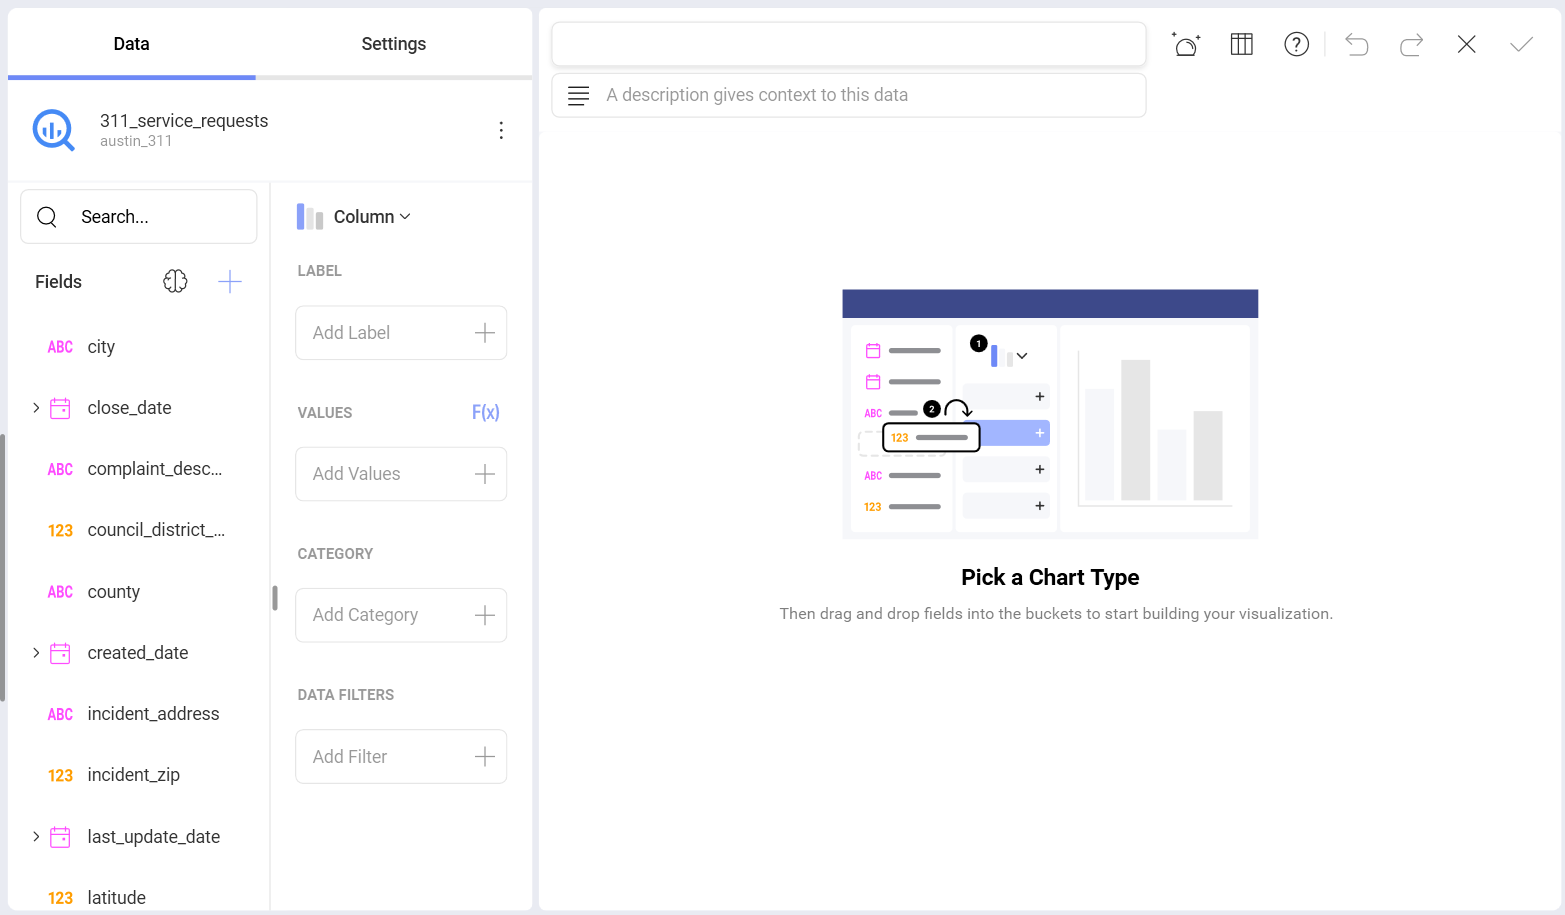
You are now directed to the Visualization editor where you can start building your visualizations with the data retrieved from Google BigQuery.
Limitations in the Visualization Editor
When working with big data in Analytics, there are a couple of limitations in the Visualization Editor due to the specific approach used to handle data sources storing millions of records.
Limitations in Functions Available for Calculated Fields
Currently, only a limited number of functions are available for Calculated Fields using data from BigQuery:
Date - date; time.
Logic - false; true; if; not.
Math - abs; exp; log; log10; mod; rand; sign; sqrt; trunc.
Strings - find; len; trim; lower; mid; upper.
Limitations in Data Blending
Currently, Data Blending (combining data sources in one visualization) is not available when using data from the Google BigQuery data source.