Hubspot
Upon connecting Hubspot, you will see the following login prompt:
You can enter your login credentials and click on Log In.
[!Note] In case you have activated 2-factor authentication, you will need to enter a verification code.
Setting Up Your Data
After logging in, you can set up your Hubspot data in the following dialog:
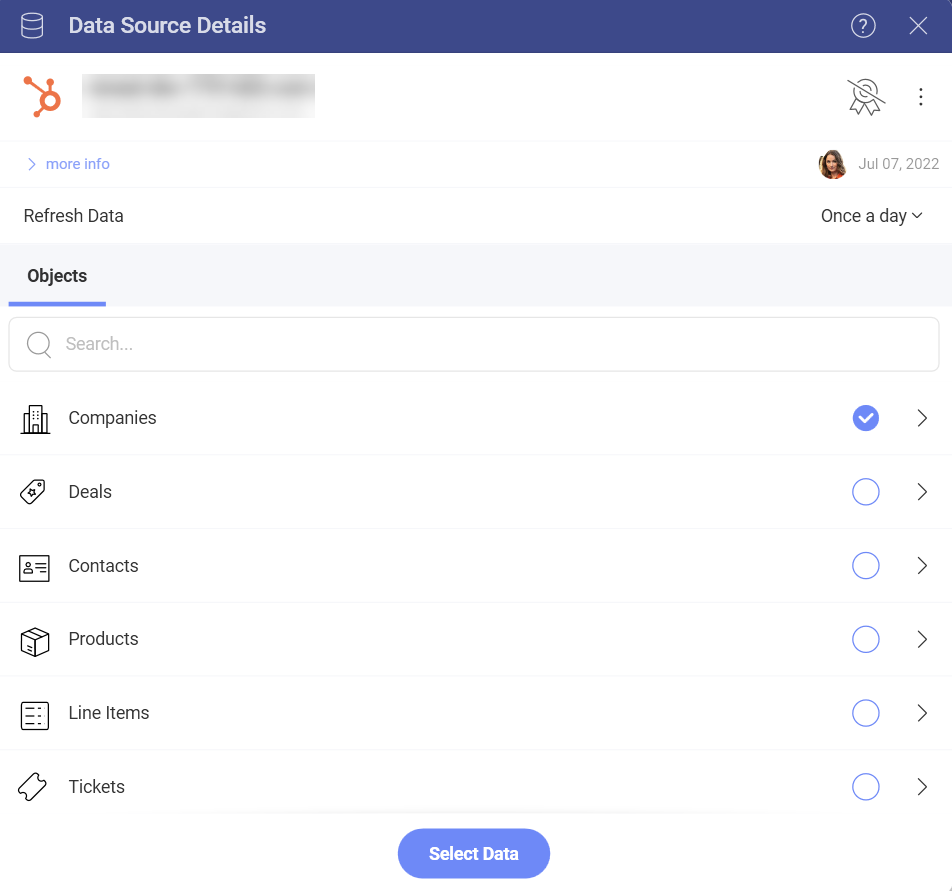
Here you will find a list of your Hubspot Objects. In big lists, use the Search to find quickly the object you need.
Note
Calendar Objects. Calendar Events objects require you to set two parameters - from and to (dates) to query the data, before you can continue to the Visualization editor.
Working in the Visualization Editor
Once your data source has been added, you will be taken to the Visualization Editor. Note that the Column visualization will be selected by default. You can click/tap on it in order to choose another chart type from the drop-down menu.
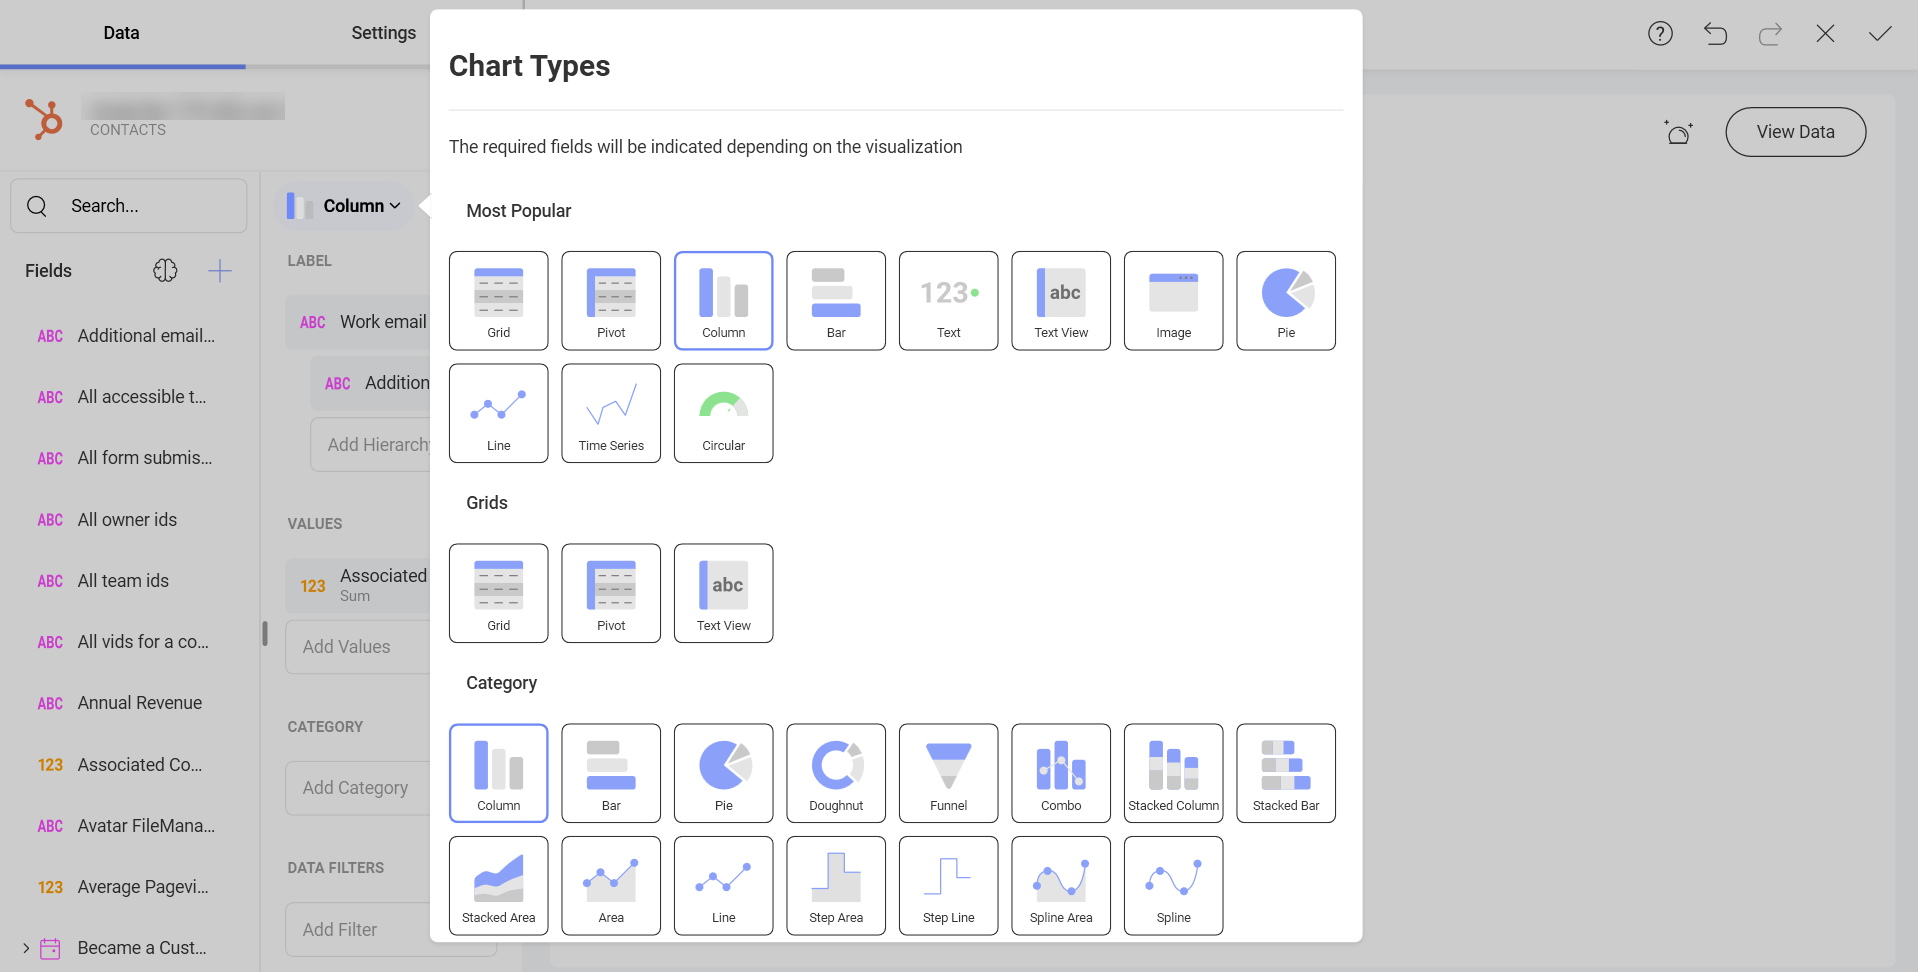
Based on the visualization that you have chosen, you will see different types of fields.
When you are ready with your visualization, you can click/tap on the checkmark in the top right corner to save it as a dashboard.