The Instagram data source allows you to connect your Instagram Business account data to Slingshot. With the help of insightful dashboards, you can have a better overview of the brand awareness of your company.
Connecting an Instagram Business account to Slingshot
To add an Instagram data source to your list, follow the steps described below:
Click on the +Dashboard button under the My Analytics section.
Click on the +Data Source button.
Select Instagram as your data source. You can find it under Social Media in the data sources list.
Log in to your Instagram Business account. If you don’t have one, you can head here to find more information about how you can create a new account. Keep in mind that you need to connect a Facebook page to the Instagram Business account.
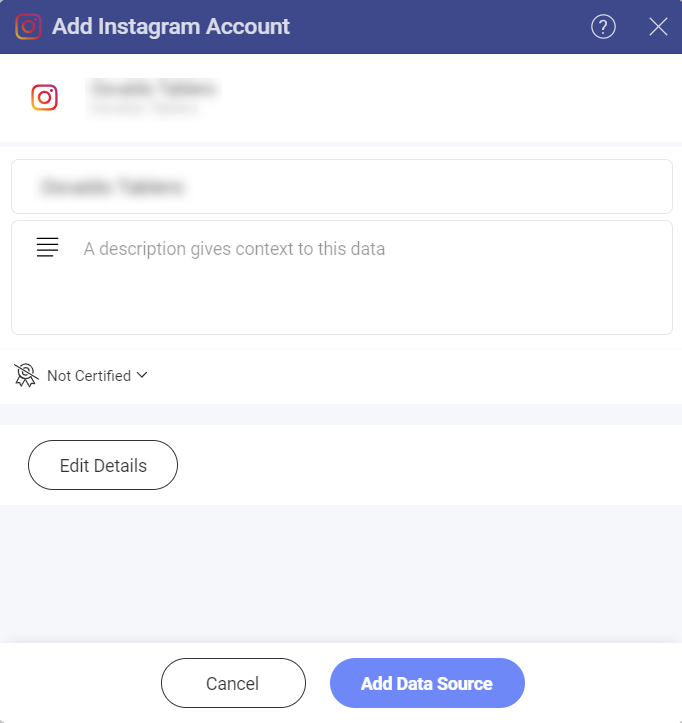
A dialog will open, where you can change the name of the data source, add a description, see if the data source is certified (available to Enterprise users), and edit the details.
Choose the pages you want to use for your dashboard and click on Select Data.
Working in the Visualization Editor
Once you have chosen/added your data source, in this case the Instagram Business account, you’ll be able to manage the data in the Visualization Editor.
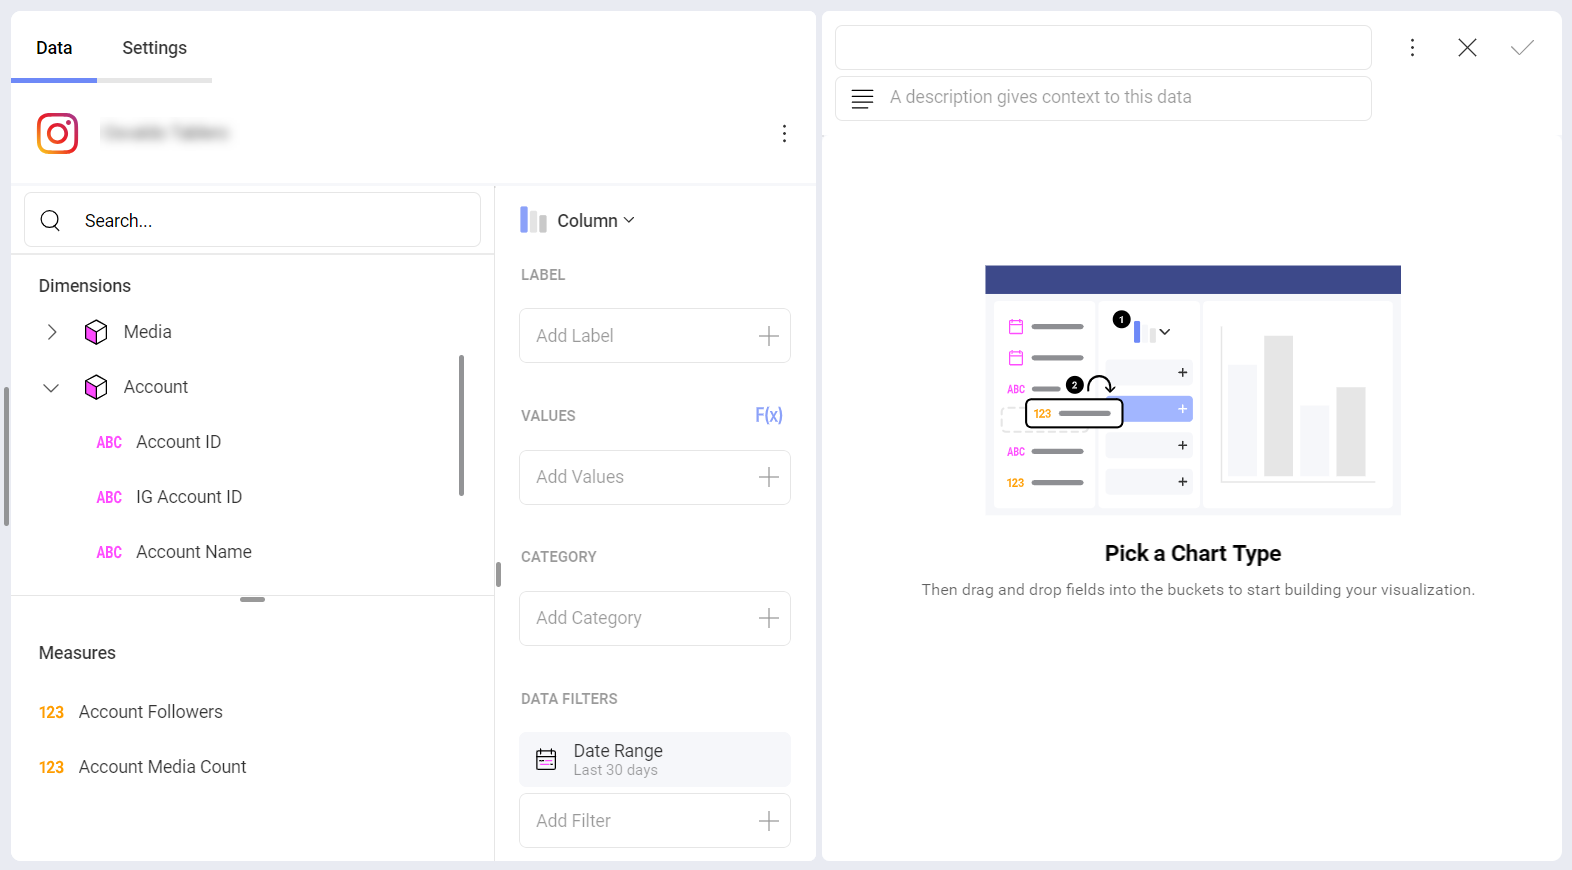
You will be presented with two sections in their own query field:
Dimensions (depicted by a cube icon with a pink side): Here you can find the attributes of your data that you want to measure.
Measures (depicted by 123 icon): Measures consist of numeric data. For example, you can see how many Account Followers and Account Media count your website has.
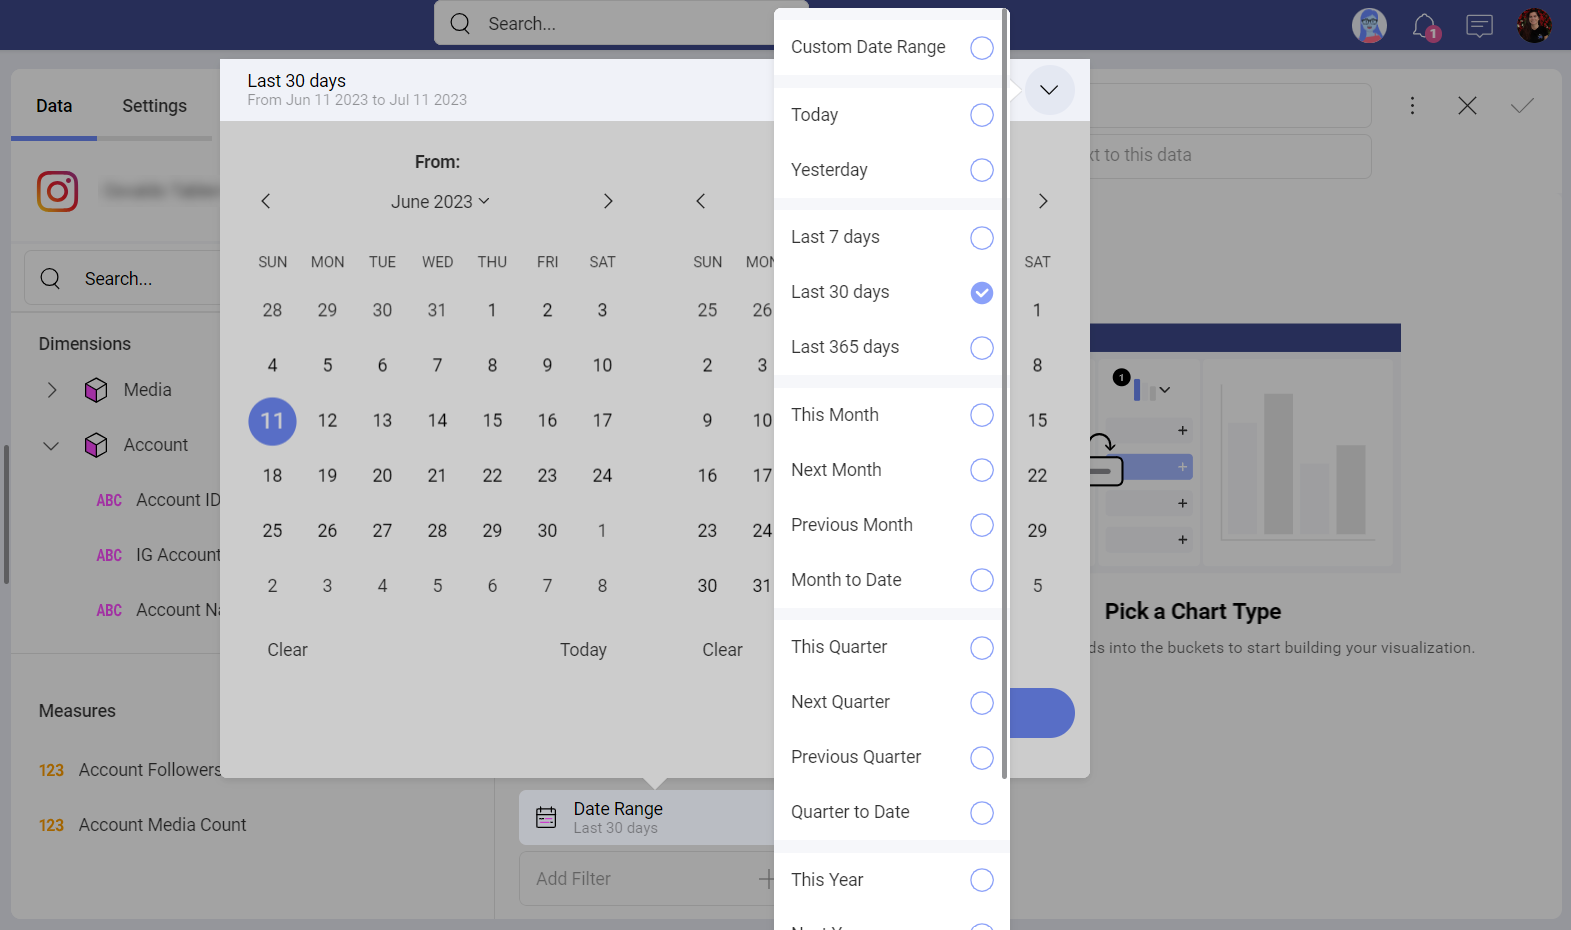
The Date Range Data Filter
You can filter your data by selecting a specific date range. Keep in mind that the data filter can’t be removed but you can change the default date range (Last 7 days).
To change the date range, you can click on the filter and then click on the arrow in the upper right corner.
Settings
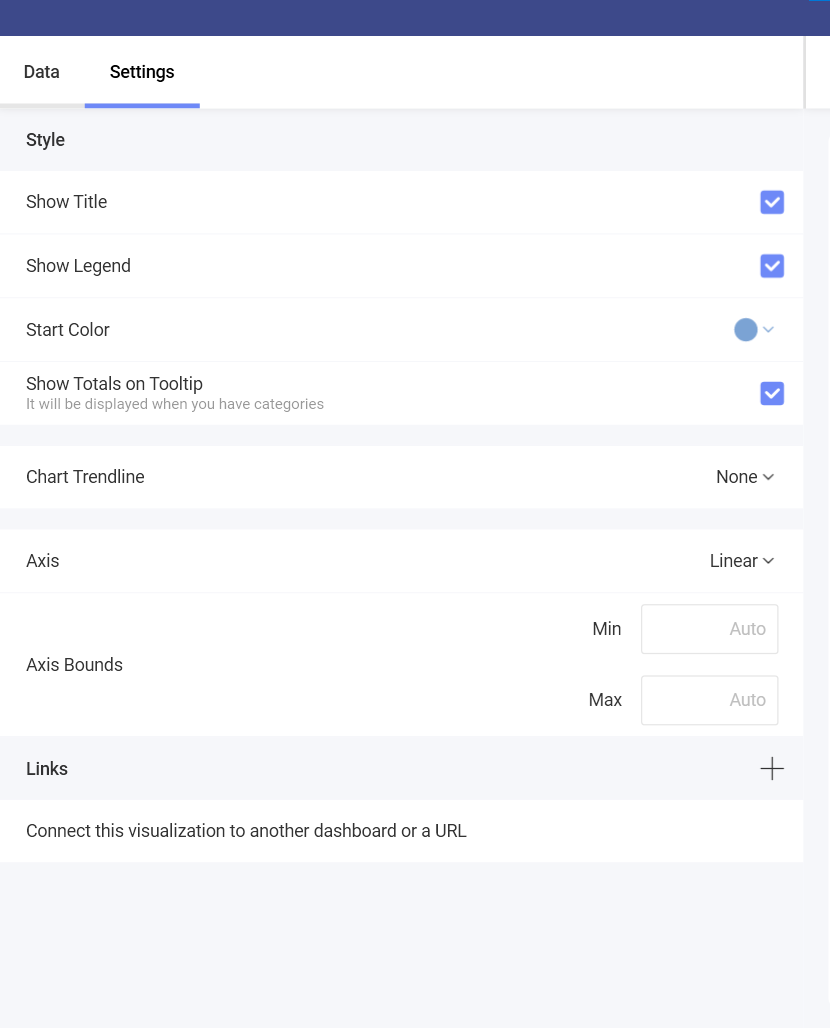
Depending on the chart type you have chosen, you will be able to make different changes in the settings. You can find more information about the different chart types in the data visualizations section here.
In the example below, we used the Column chart type which has the following settings:
Show Title
Show Legend
Start Color
Show Axis
Show Totals on Tooltip
Chart Trendline
Sync Axis to the Visible Range
Automatic Label Rotation
Zoom Level
Axis (Linear or Logarithmic)
Axis Bounds
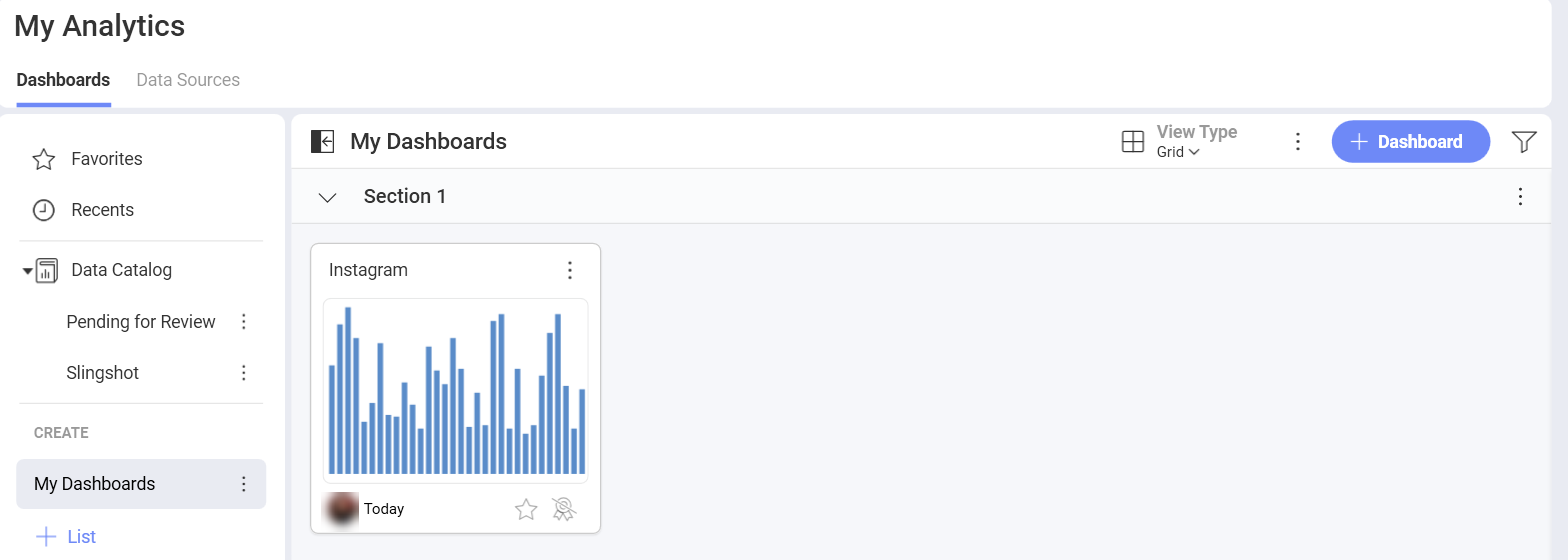
When you are ready with the visualization editor, you can save the dashboard in My Analytics ⇒ My Dashboards, a specific workspace or a project.
If you want to find more information about the data sources, you can head here.