Microsoft Analysis Services
Microsoft SQL Analysis Services (SSAS) is an OLAP (online analytical processing of information from multiple database systems at the same time) and data mining tool in Microsoft SQL Server.
[!NOTE] Limitations in Web. In the Analytics Web app, you can connect only to publicly accessible Microsoft Analysis Services addresses. If your Analysis Services address is restricted for the general public (private or hosted in the company's intranet, for example), you can use Analytics Desktop, iOS or Android to connect to it. The device where you're running Analytics needs to have access to the Analysis Services address. This limitation does not apply to Analytics Embedded.
Connecting to Microsoft Analysis Services
There are two modes you can use when configuring a Microsoft Analysis Services data source depending on your server's settings - Native and HTTP.
For more information on both Native and HTTP mode, visit the Microsoft Instance Management help.
Using Native
To configure the Microsoft Analysis Services data source for Native mode, you will need to enter the following information:
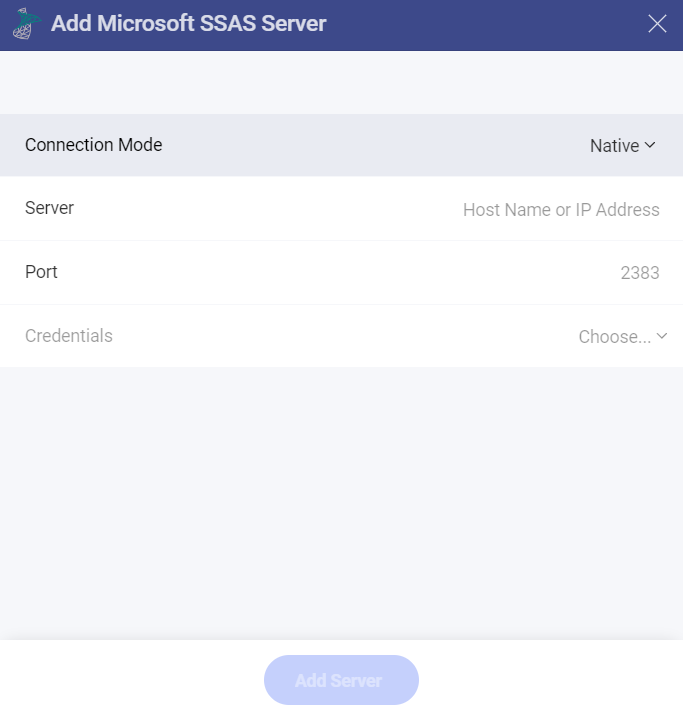
Connection Mode: two options to chose from: HTTP or Native.
Server: this is the hostname or IP address of the computer on which the server is running.
You can find the hostname by following the steps below. Please note that the commands should be executed on the server machine.
WINDOWS LINUX MAC 1. Open the File Explorer. 1. Open a Terminal. 1. Open System Preferences. 2. Right Click on My Computer > Properties. 2. Type in $hostname 2. Navigate to the Sharing Section. Your Hostname will appear as "Computer Name" under the Computer name, domain and workgroups settings section. Your Hostname will appear along with your DNS domain name. Make sure you only include Hostname in Analytics. Your Hostname will be listed under the "Computer Name" field on top. You can find the IP address by following the steps below. Please note that the commands should be executed on the server machine.
WINDOWS LINUX MAC 1. Open a Command Prompt. 1. Open a Terminal. 1. Launch your Network app. 2. Type in ipconfig 2. Type in $ /bin/ifconfig 2. Select your connection. IPv4 Address is your IP address. Inet addr is your IP address. The IP Address field will have the necessary information. (Optional) Port: server port details. If no information is entered, Analytics will connect to the port in the hint text (2383) by default.
Credentials: after selecting Credentials, you will be able to enter the credentials for your Microsoft Analysis Services or select existing ones if applicable.
Using HTTP
To configure the Microsoft Analysis Services data source for HTTP mode, you will need to provide the following information:
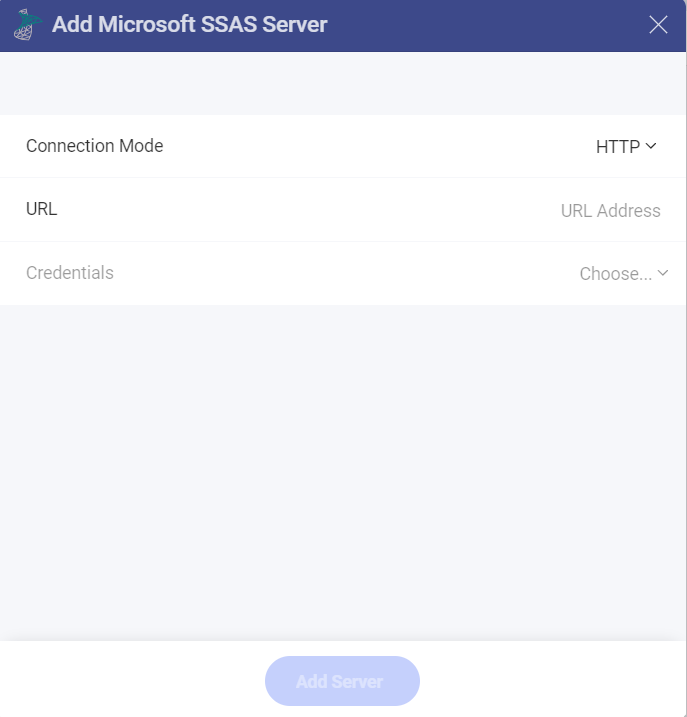
Connection Mode: two options to chose from: HTTP or Native.
URL: the HTTP eService URL to the server. For example, 10.1.0.15/olap/msmdpump.dll.
Credentials: credentials of your user account for the Analysis Services server.
Configuring Databases
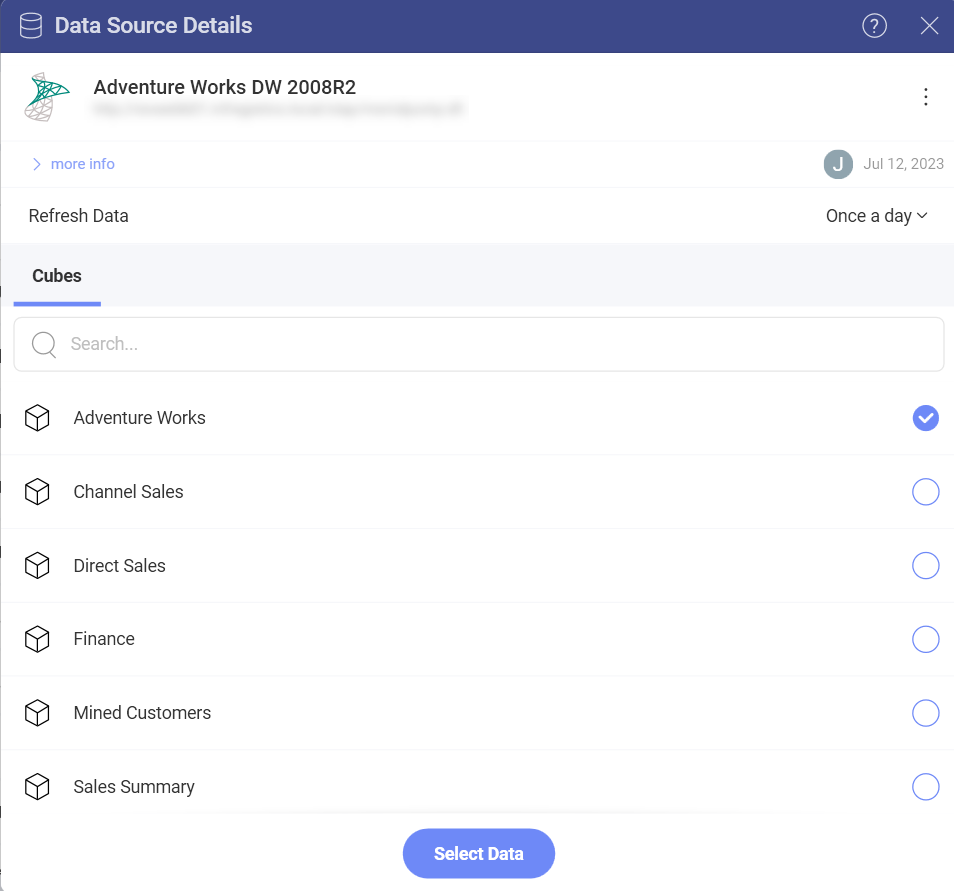
After your credentials for the Analysis Services server are verified, Analytics will load and show the databases on the server. From there, you can:
Select a database.
Click/tap on Select and continue to set it up.
Choose a database cube.
Click/tap on Select Data to continue to the Visualization Editor.
Working in the Visualization Editor
When you create a dashboard using a cube data source like Microsoft Analysis Services, you will see fields organized differently in the Visualization Editor (see screenshot below). Cube data sources consist of hierarchies and aggregations, which have been created by the cubes' designers in advance.
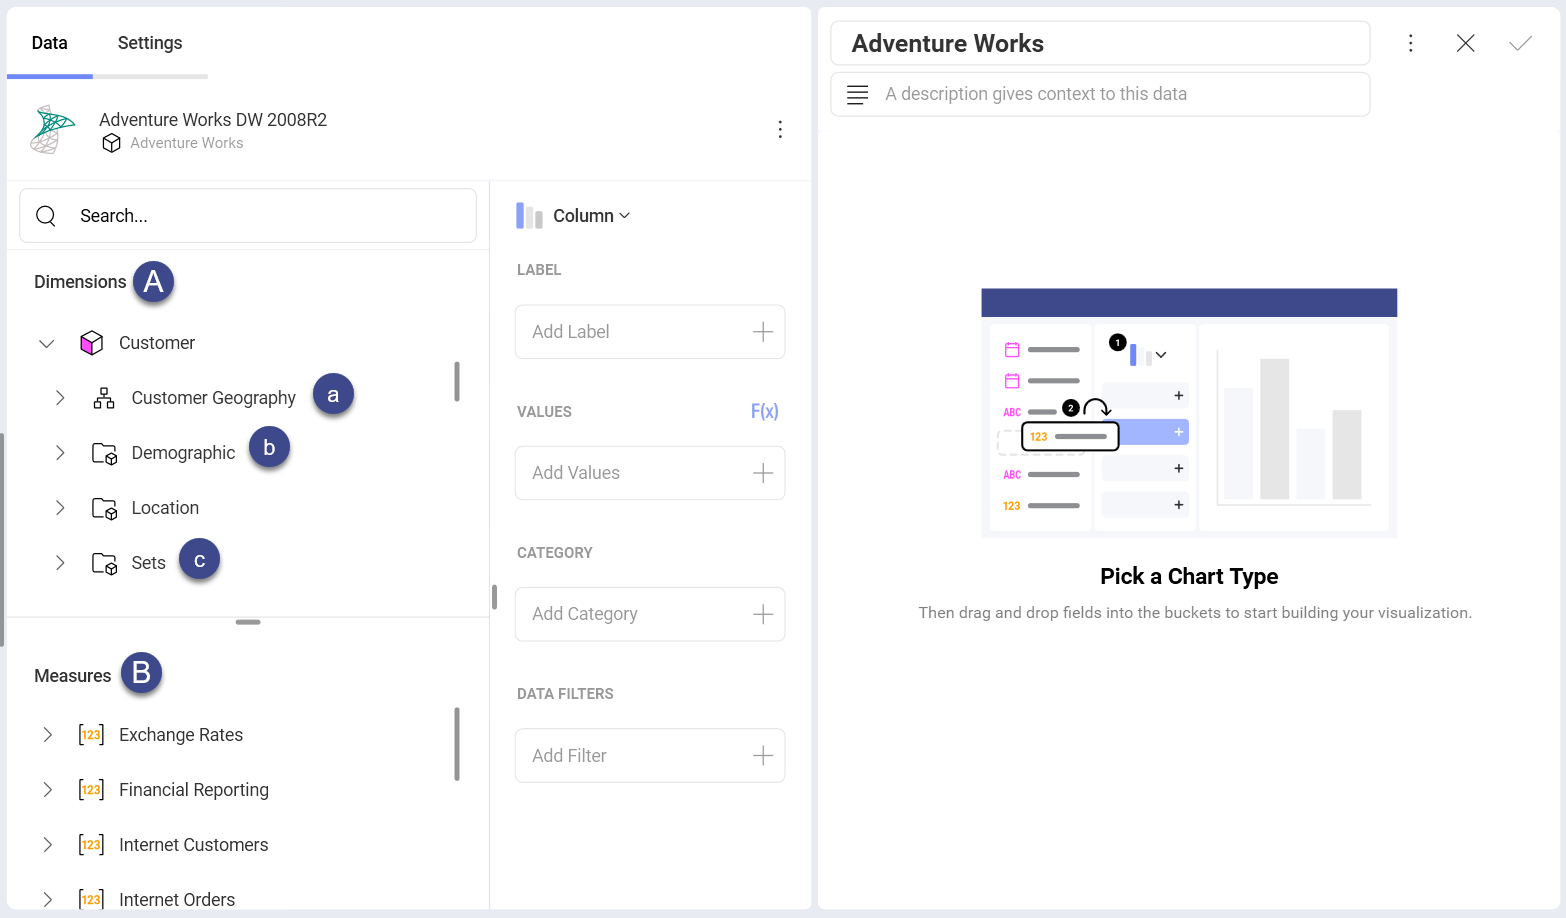
In the screenshot above, you may notice that there is no "Fields" heading on the left. Instead, there are two sections in their own query field:
Dimensions (depicted by a cube icon with a pink side): Dimensions are structures used to categorize data that can be measured. Elements in a dimension can be organized by:
a. Hierarchies - when elements in a dimension are organized by hierarchy, you can use the whole hierarchy or part of it, starting from an element at any lower level. For example, if you have a "Geography" dimension organized in "Country ⇒ State ⇒ City" hierarchy, you are allowed to drag and use only the "State ⇒ City" part of this hierarchy.
b. Attributes - elements are organized in single-level hierarchies (e.g. a "Demographic" attribute, containing groups of elements like "Gender," "Marital Status," etc.)
c. Named Sets (depicted by a folder icon and named "Sets") - an arbitrary collection of elements with a name (e.g. "Top 50 Customers").
Measures (depicted by [123] icon): Measures consist of numeric data.
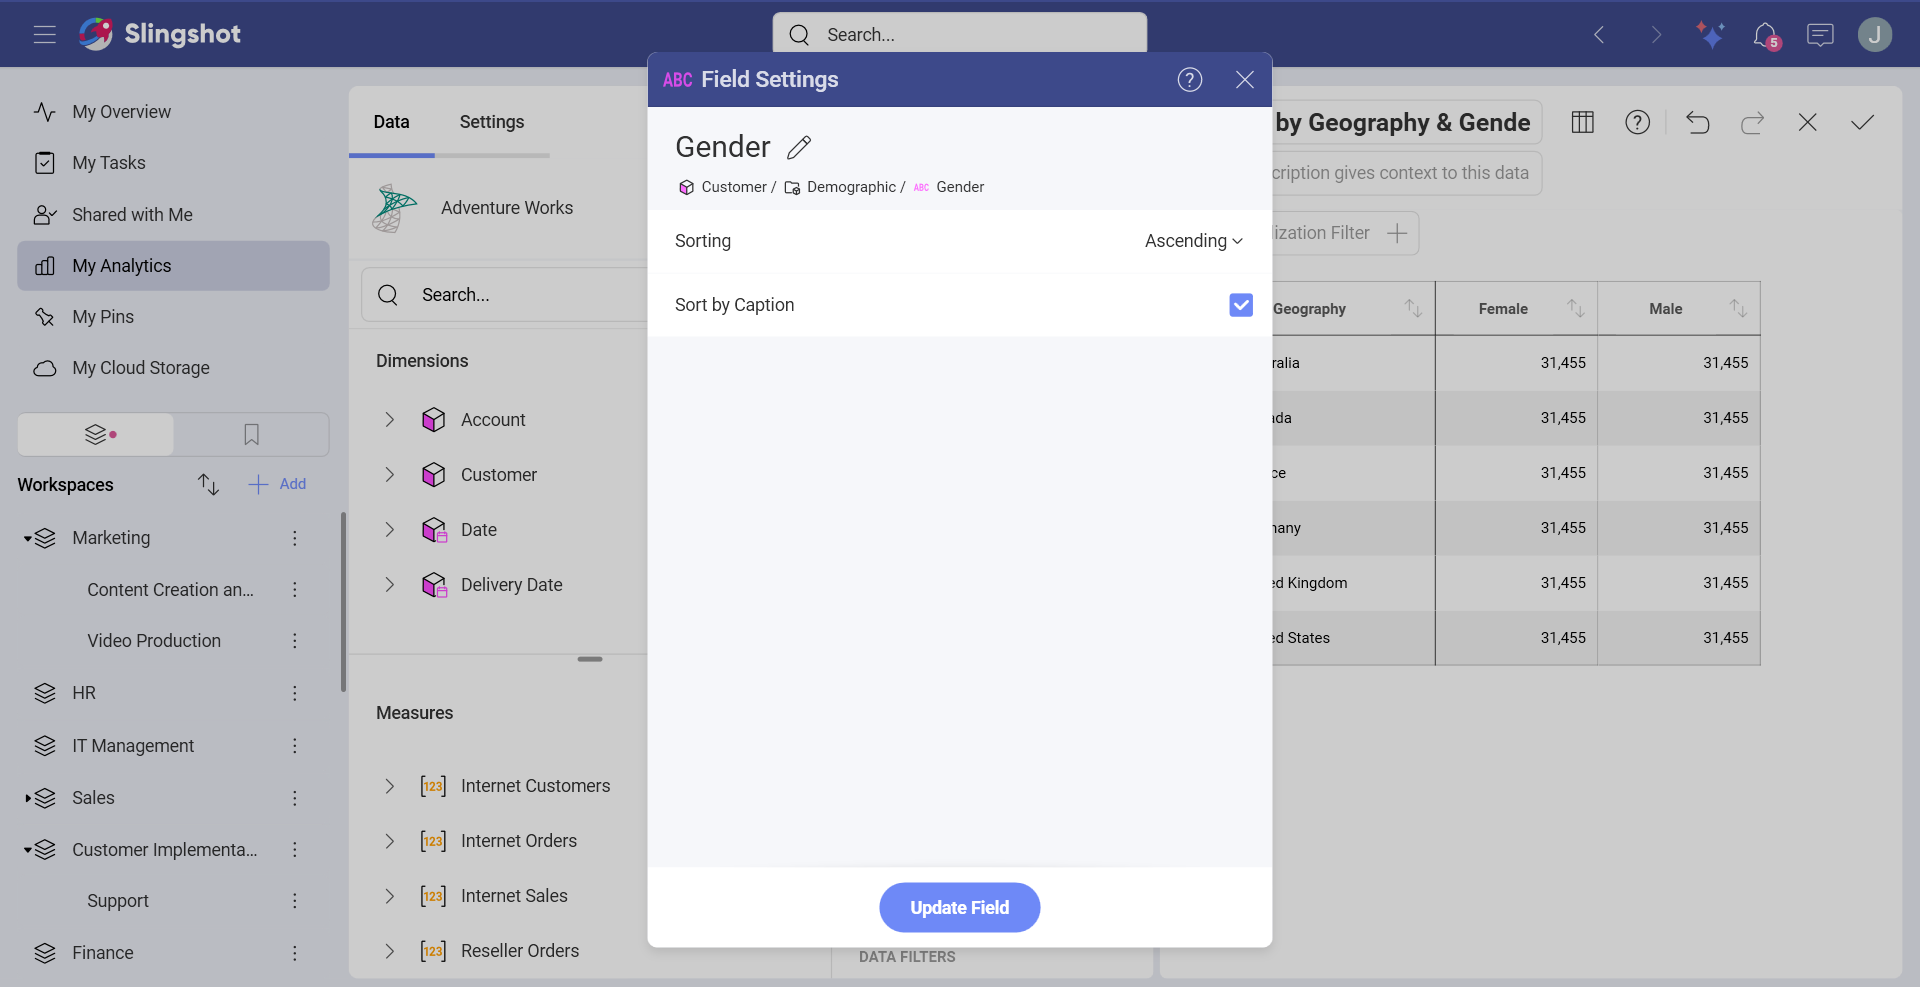
Sort by Caption Setting
There is also a Sort by Caption option which defines whether the filter will be applied to the dimension's labels or to the corresponding values. When enabled, Sort by Caption sorts the dimensions alphabetically by their label.
To enable it, select a dimension in Rows or Columns. Enable Sorting for the field by choosing Ascending or Descending to have the Sort by Caption option show up:
Settings
Depending on the chart type, you can make different changes in the settings. In this case we used the pivot chart type where you can adjust the following through the settings menu:
Show Title
Text Fields Alignment
Number Fields Alignment
Date Fields Alignment
Font Size
Show Grand Totals
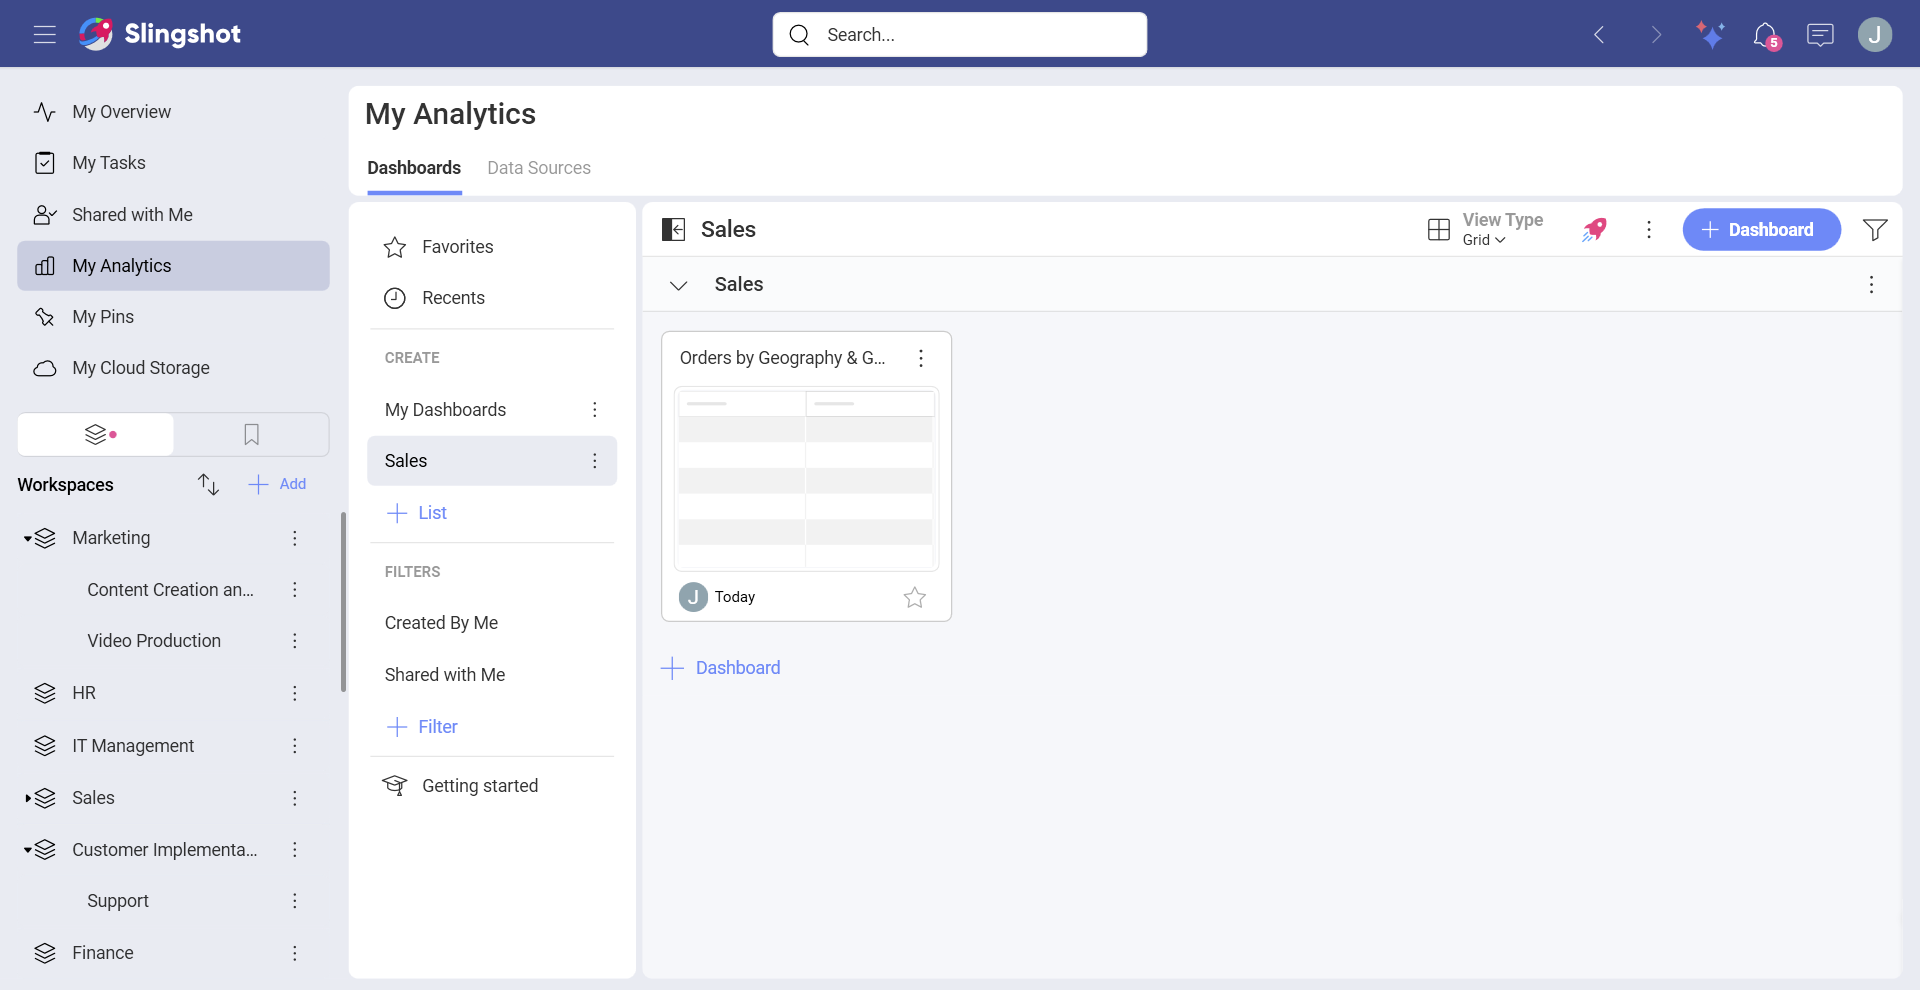
When you are ready with the Visualization Editor, you can save the dashboard in My Analytics ⇒ My Dashboards, organization, a project or in a specific workspace.
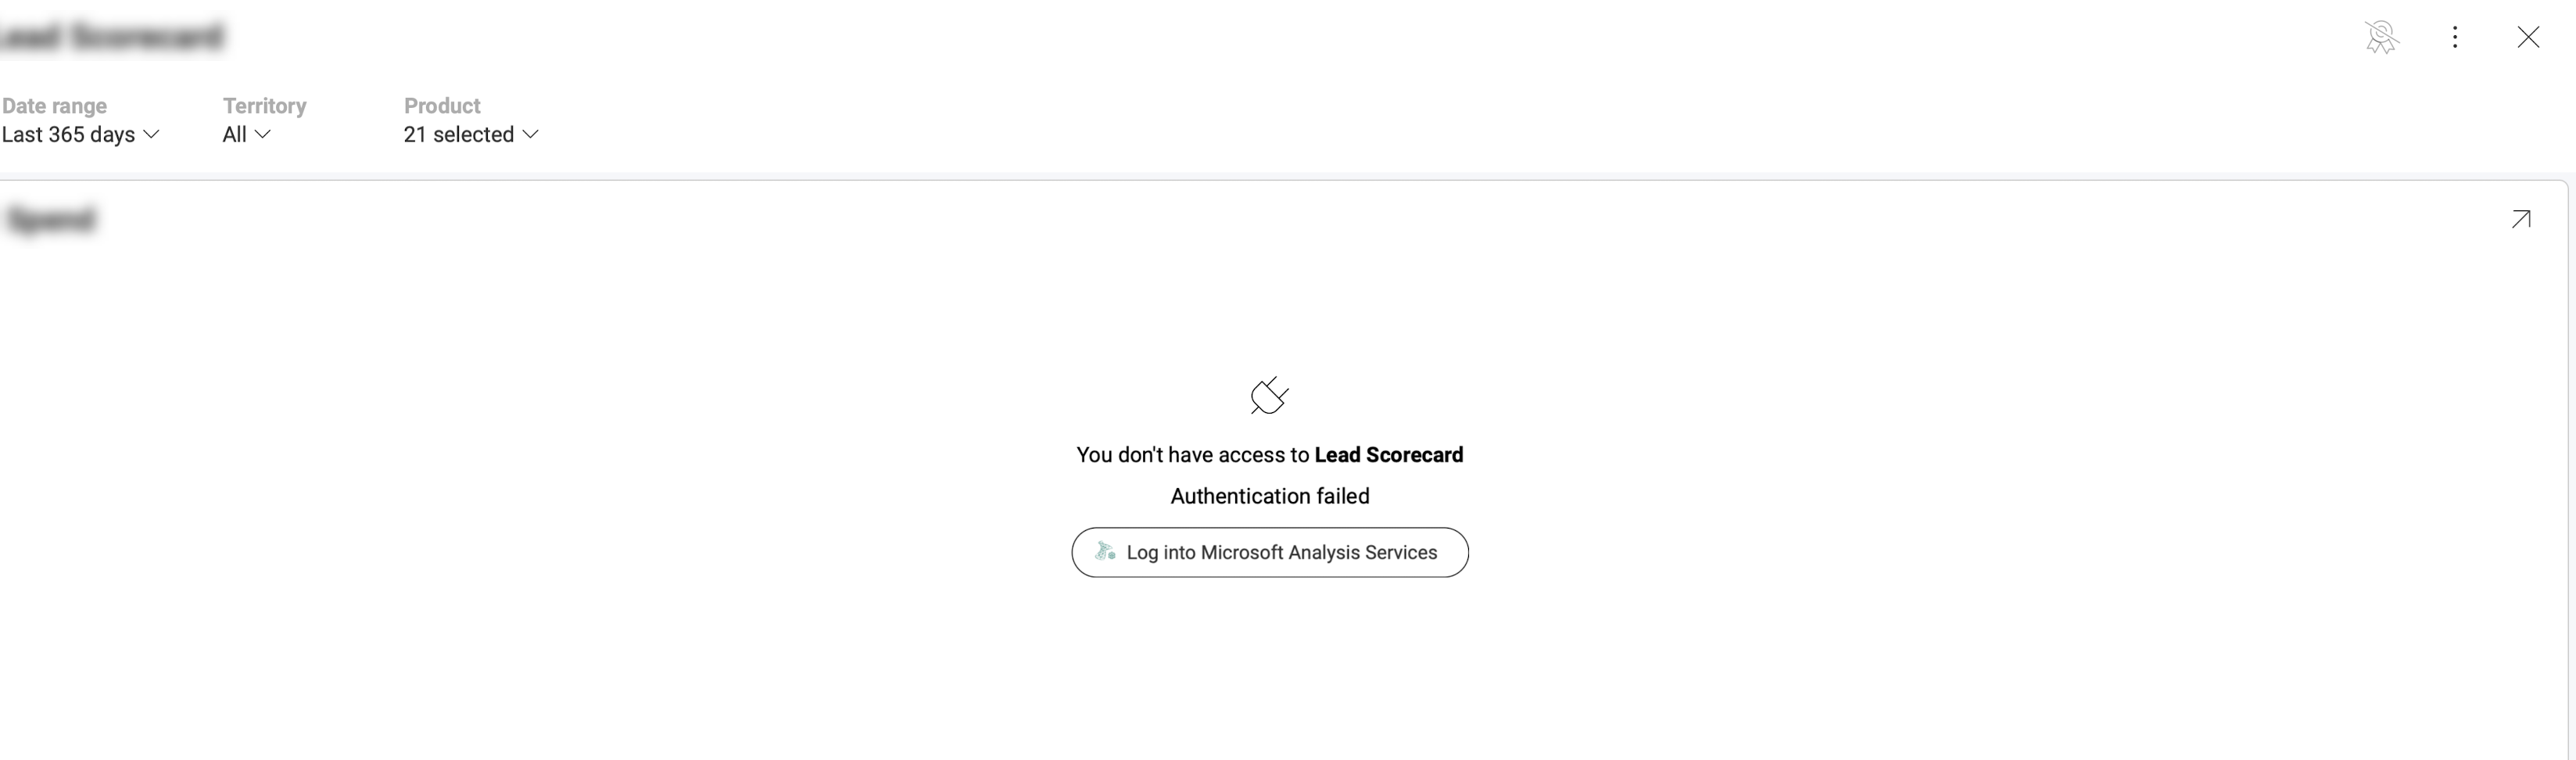
In case you've entered wrong credentials, you will get an error message (screenshot below). You can click on Log into Microsoft Analysis Services and update your credentials. That should fix the issue.