Creating an Image Chart
In this tutorial you will learn how to create an Image visualization using a sample spreadsheet.
Key Concepts
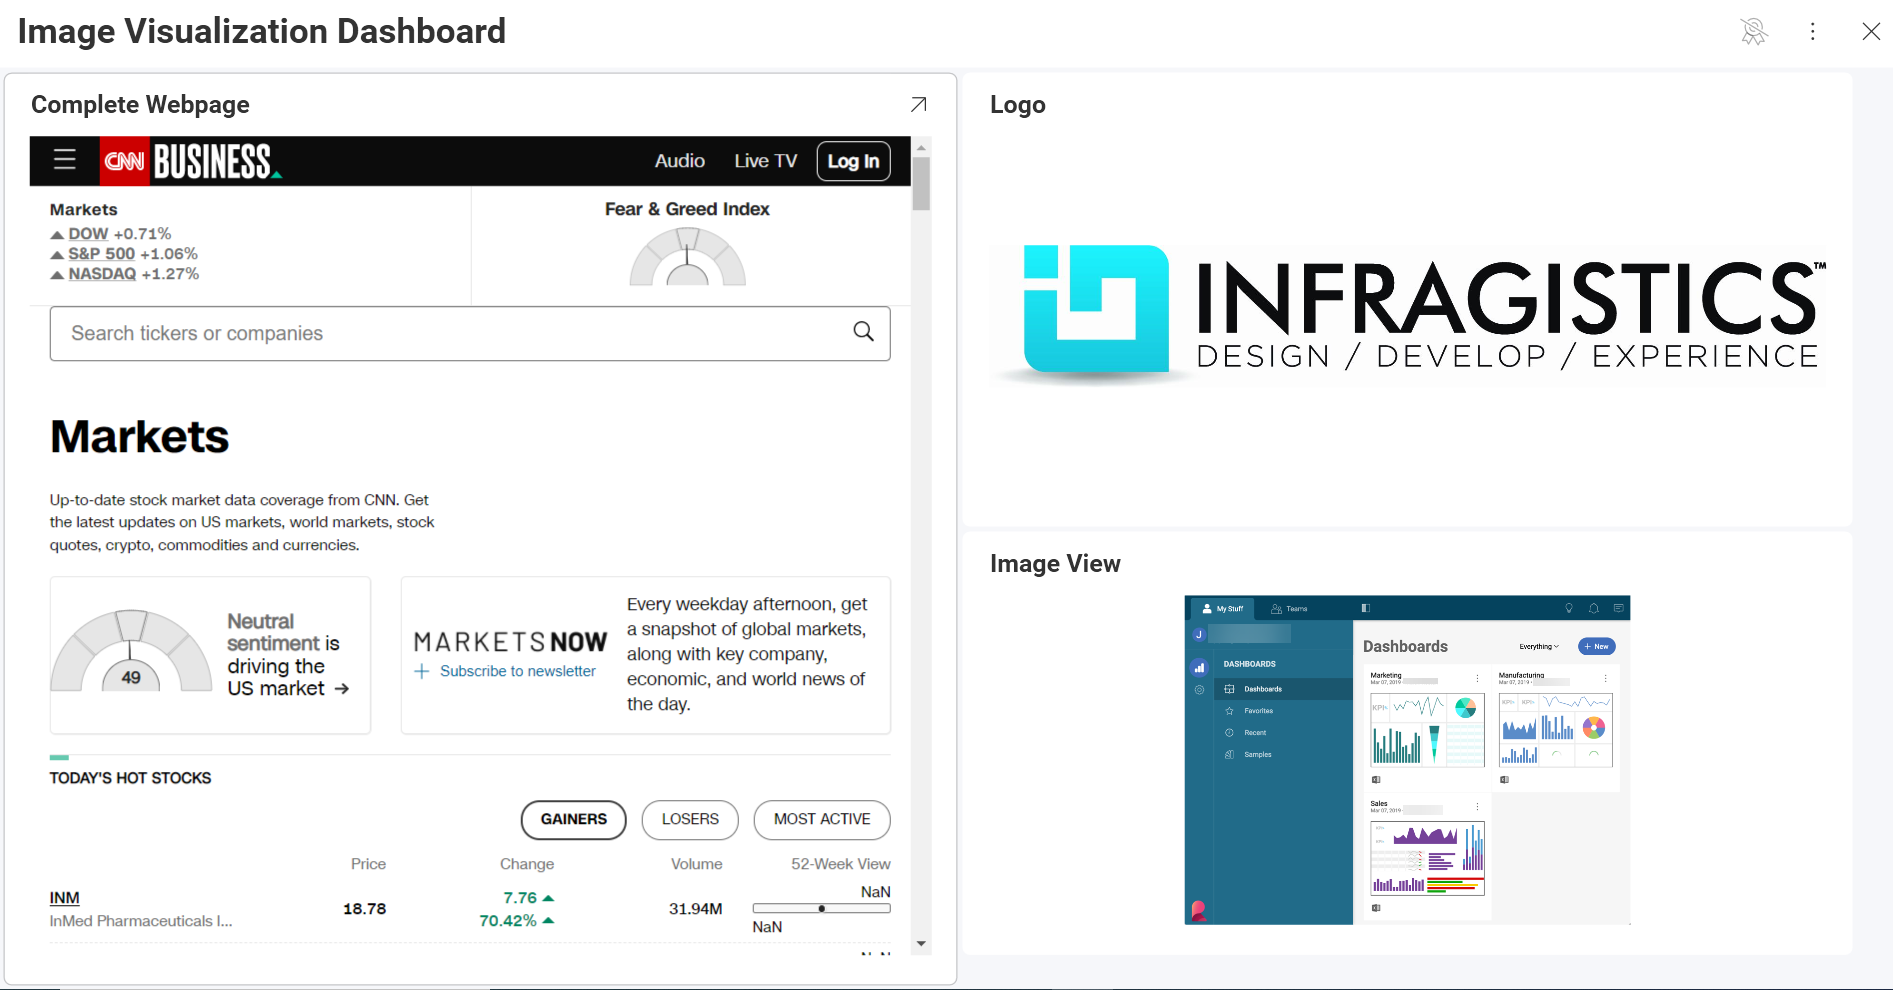
As mentioned in the Data Visualization section, the Image Chart displays information in an embedded browser by making a request to a URL and displaying the results. The data source, therefore, will need to:
Include a link to a web resource to be displayed in the widget.
Include it in the first row of the data set.
Sample Data Source
For this tutorial, you will use the Image Chart sheet in the Slingshot Visualization Tutorials.
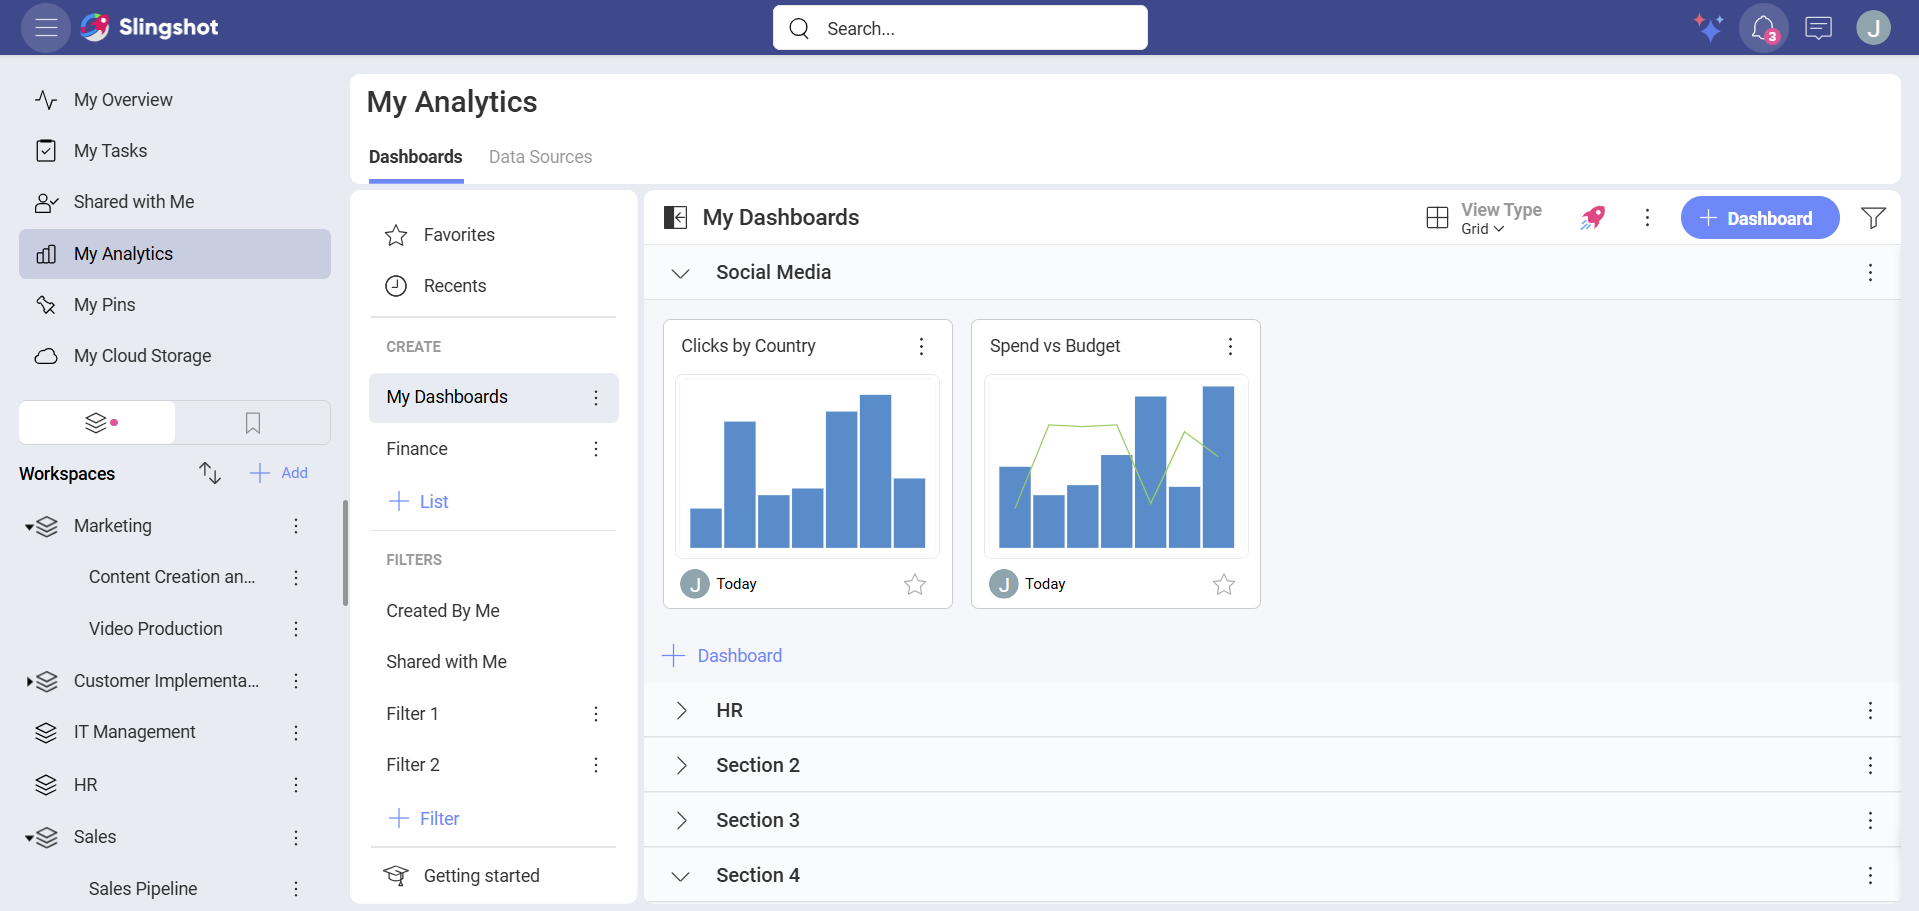
Depending on where you want to save the dashboard, you can open a dashboard list in My Analytics, a workspace or a project. You can always move the dashboard to another location later on.
Click/tap on the + Dashboard button.
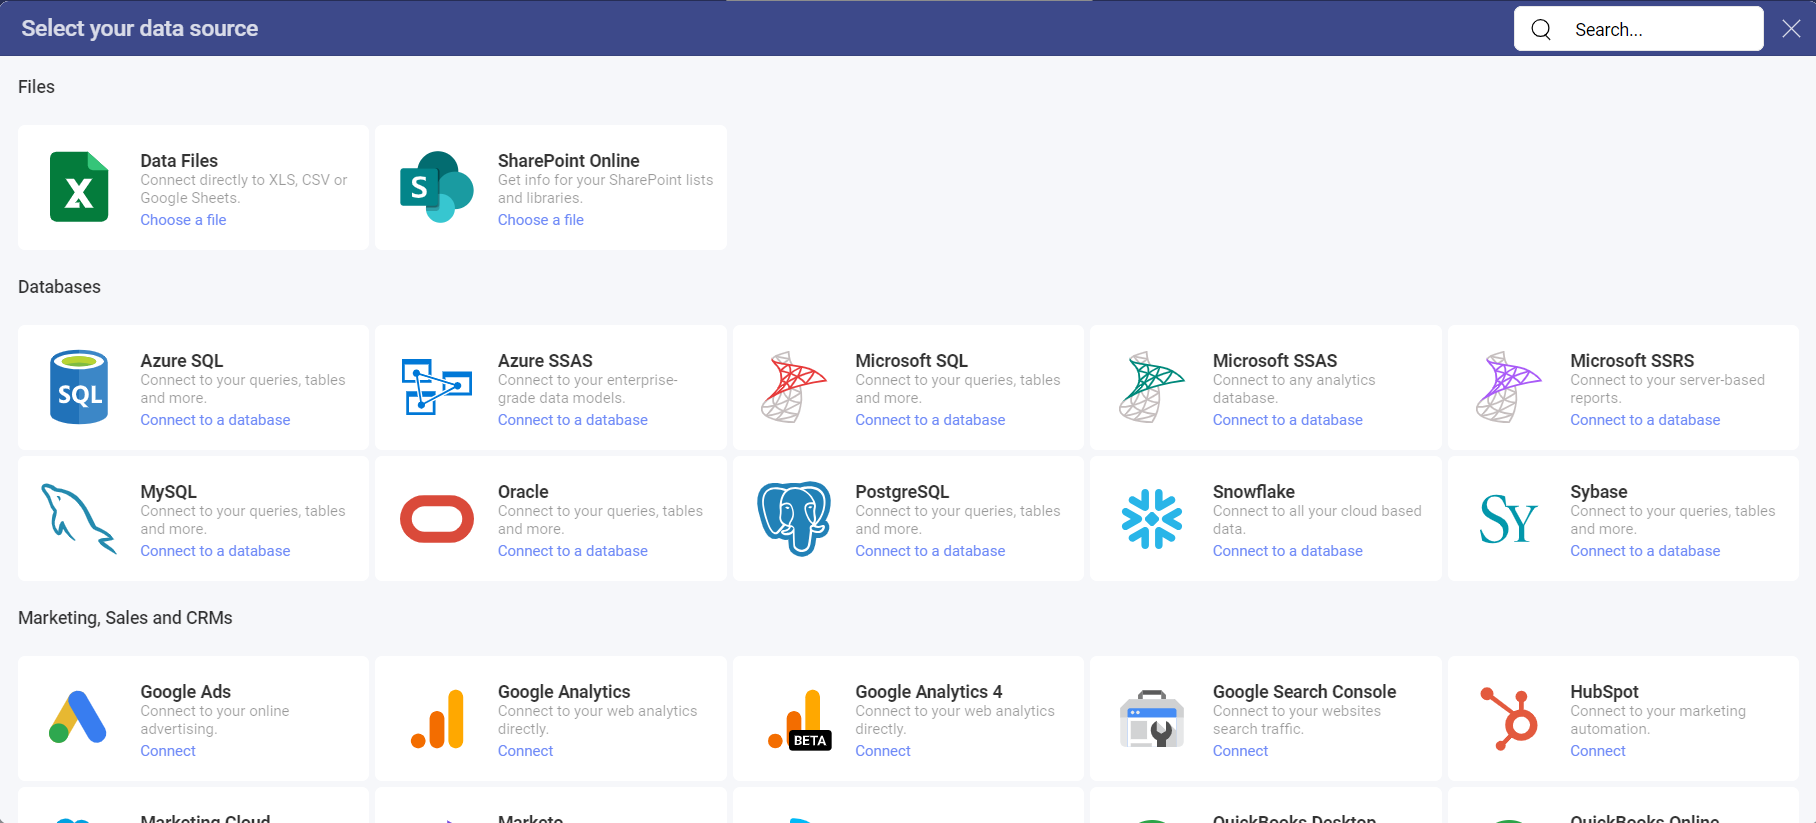
A dialog will open, containing a list of already added data source. The Visualization Tutorial file will be there as a data source if you have already used it. In case you haven't added the file, you can click/tap on +Data Source ⇒ Data Files ⇒ +New ⇒ Upload ⇒ Select the file ⇒ Click/tap on Select and Continue to include it in the list.
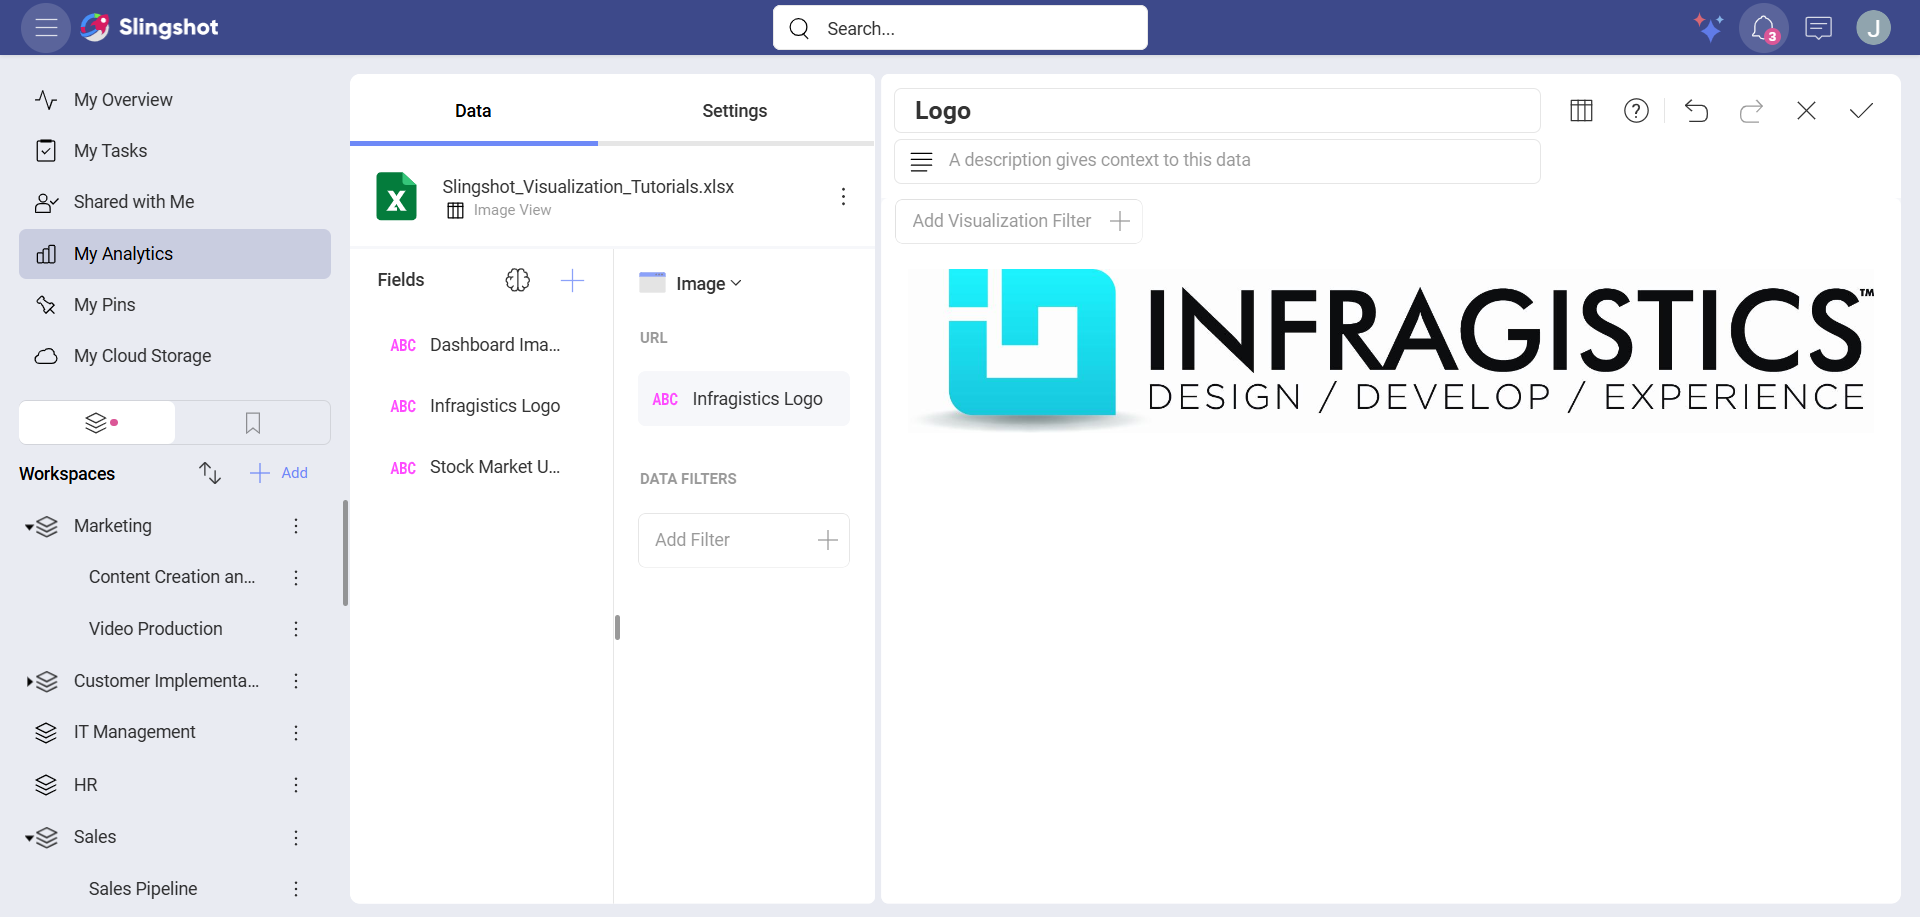
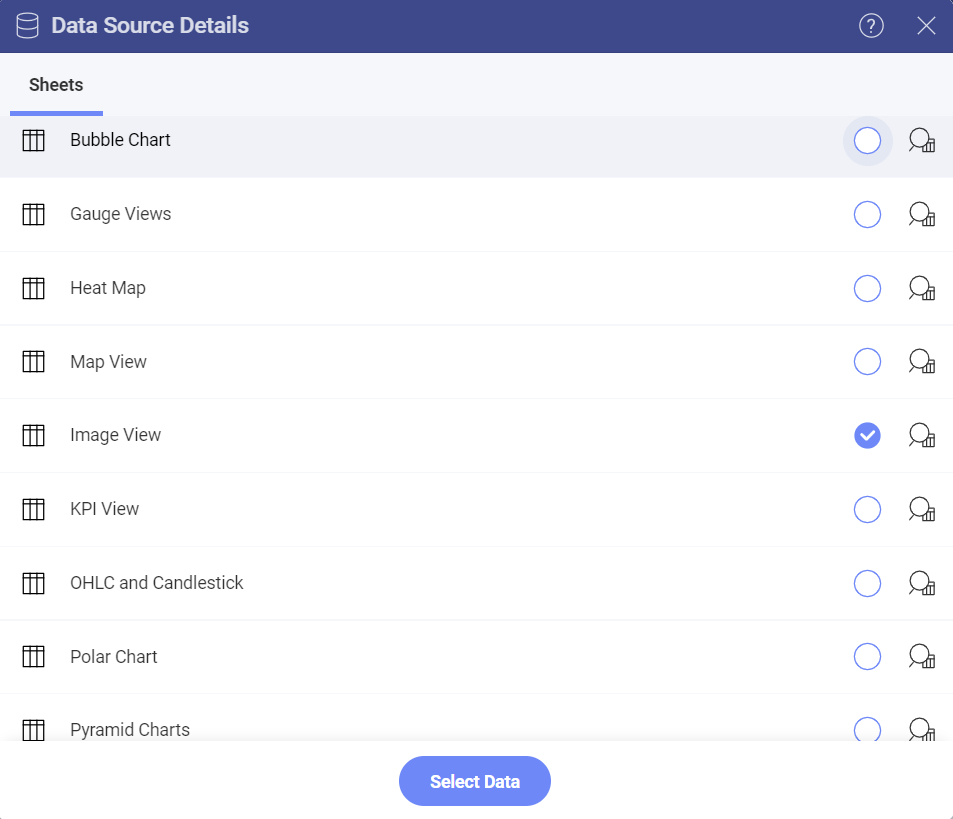
Once the data source is configured, select the Image View sheet.
By default, the visualization type will be set to Column. Select the Image option.
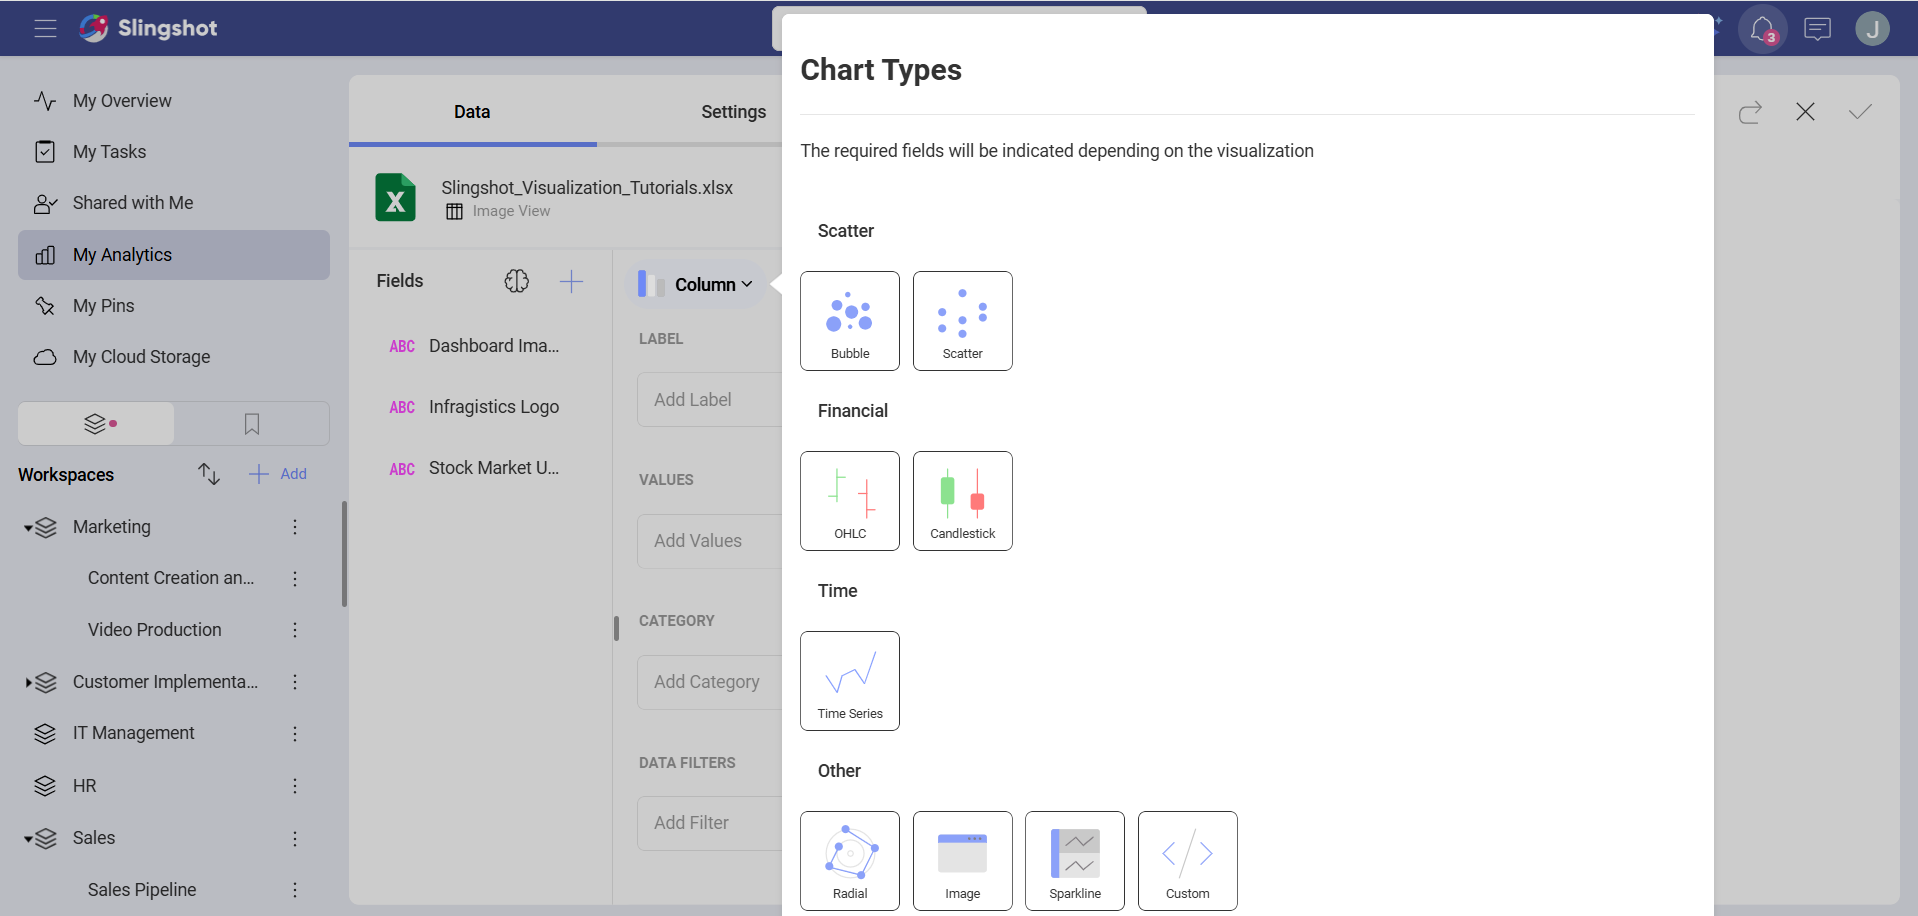
Drag any of the available fields into URL.