Creating a Text View
In this tutorial you will learn how to create a Text View visualization using a sample spreadsheet.
Access the links below for the Text view walkthroughs.
Key Concepts
Text views display information in a key-value pattern, but they only display the first row of data paired with a column's label. You can, however, add filters to make sure Slingshot displays the row you need.
Sample Data Source
For this tutorial, you will use the Simple Series Charts sheet in the Slingshot Visualization Tutorials.
Note
Excel files as local files are not supported in this release. In order to follow these tutorials, make sure you upload the file to one of the supported cloud services or add it as a Web Resource.
Creating a Text View
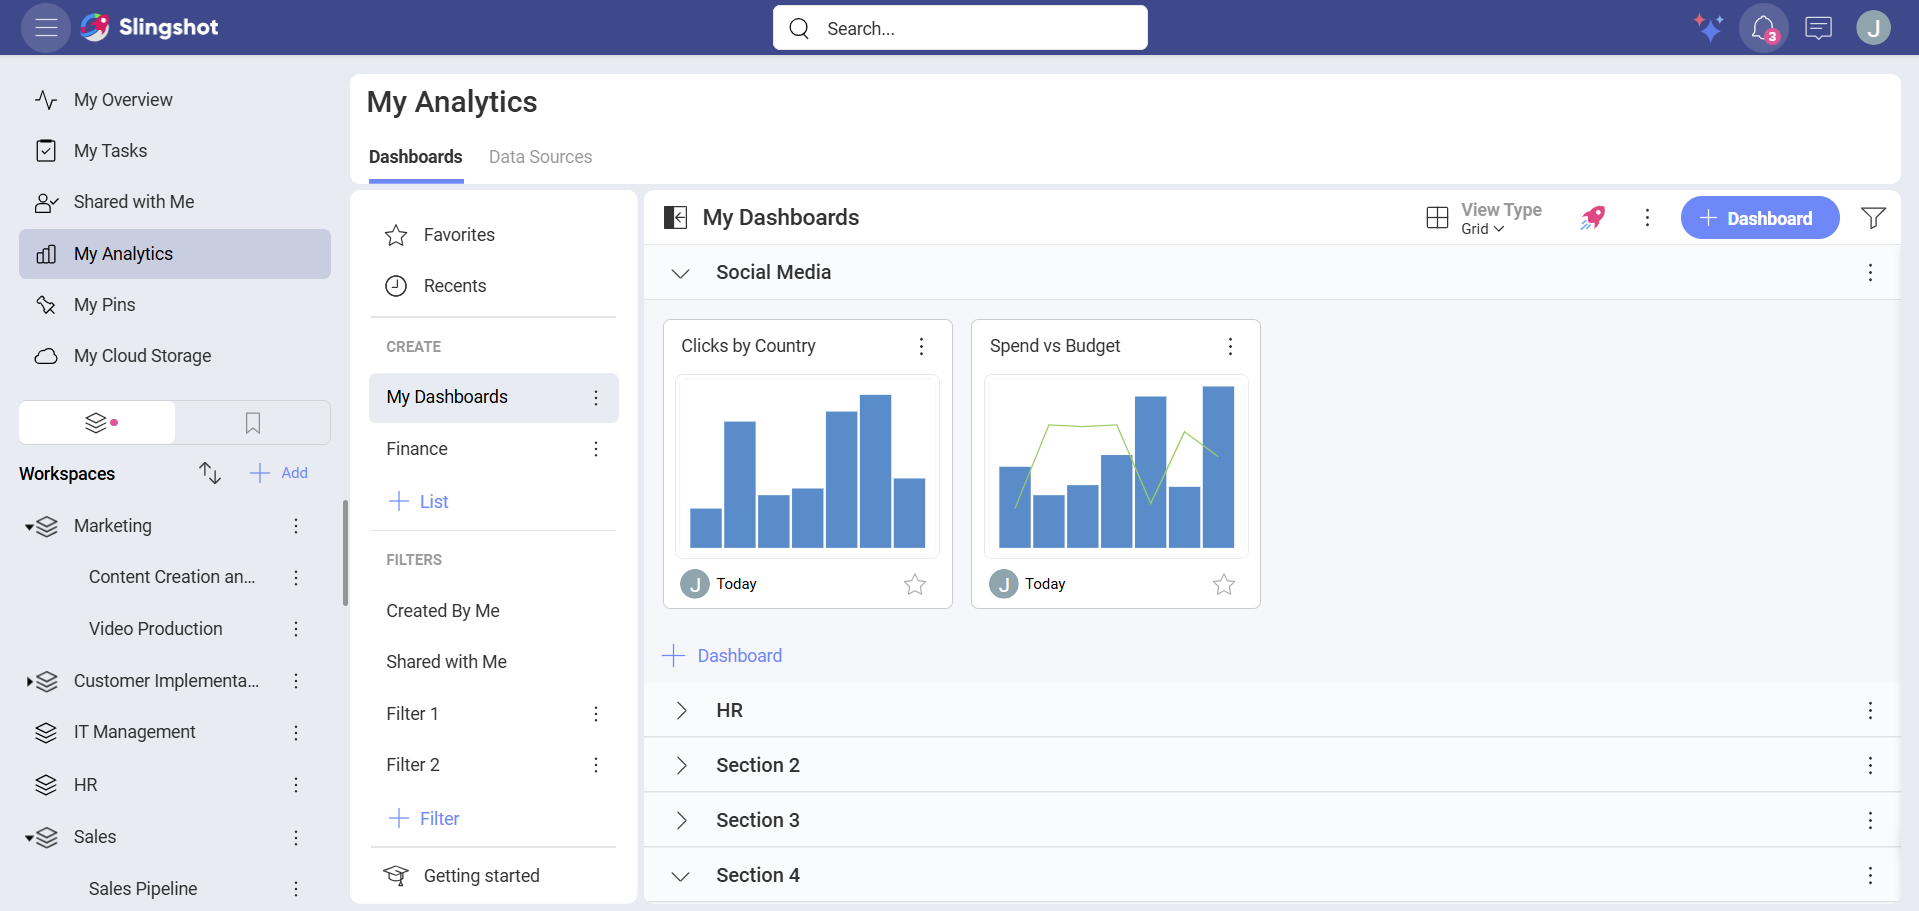
Depending on where you want to save the dashboard, you can open a dashboard list in My Analytics, a workspace or a project. You can always move the dashboard to another location later on.
Click/tap on the + Dashboard button.
You can choose the data source you want to work with from the list of data sources. If the data source is new, you will need to add it from the + Data Source button.
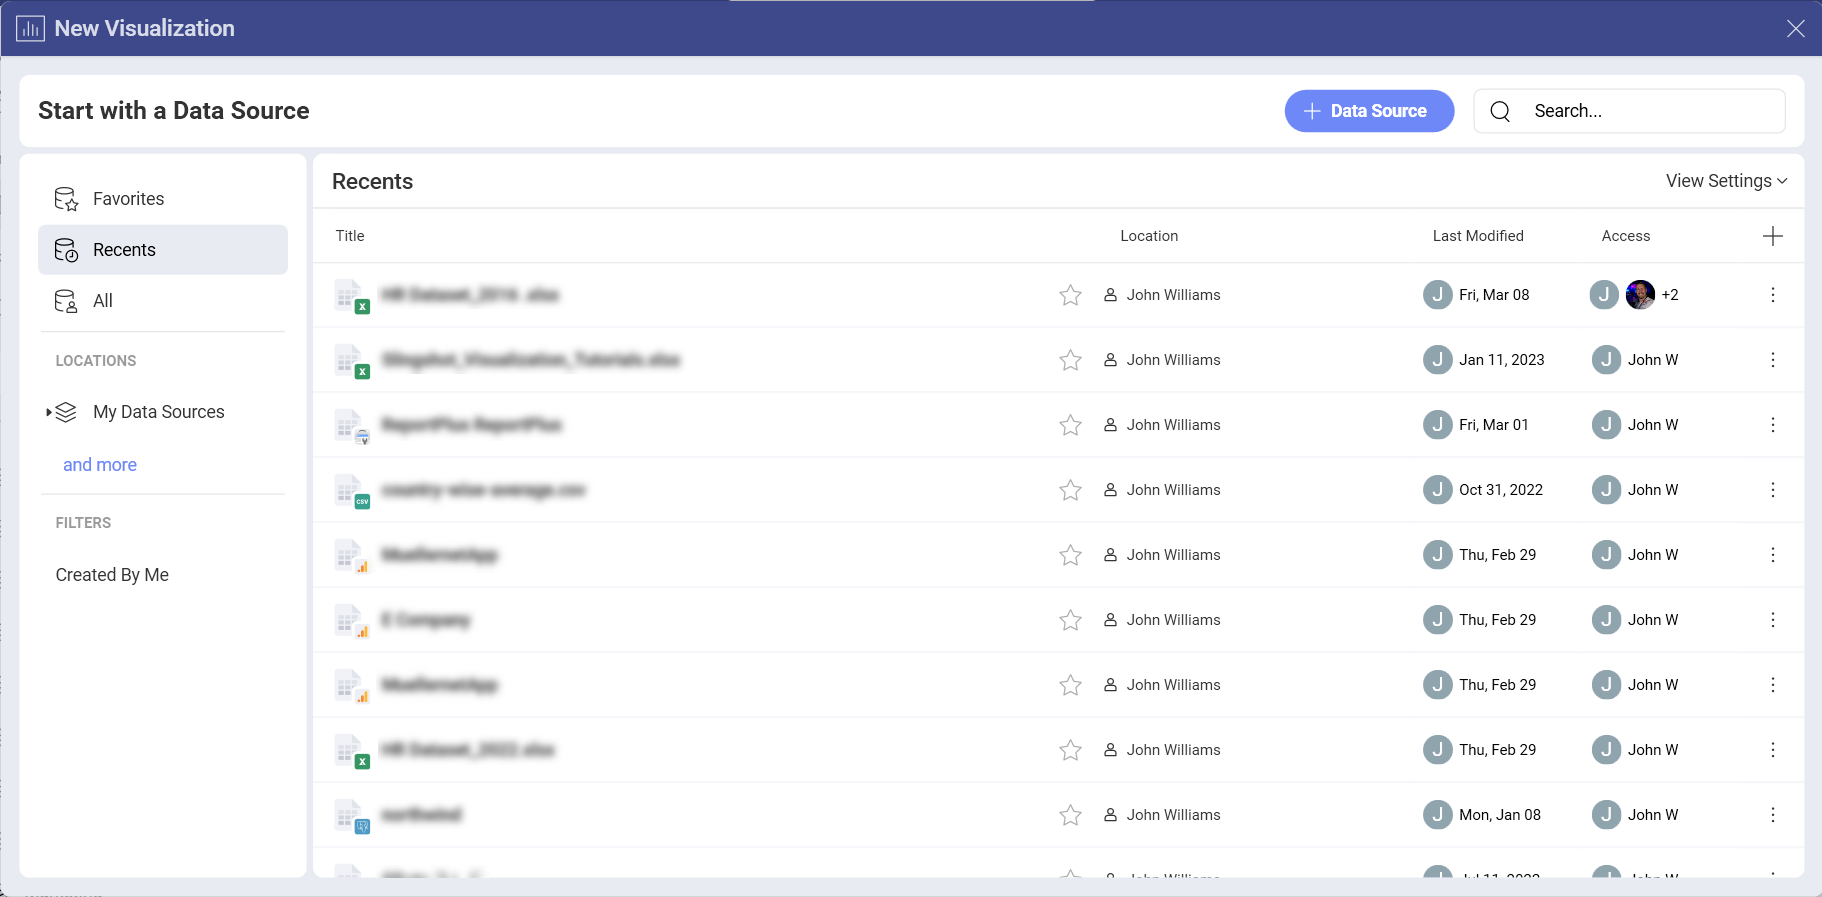
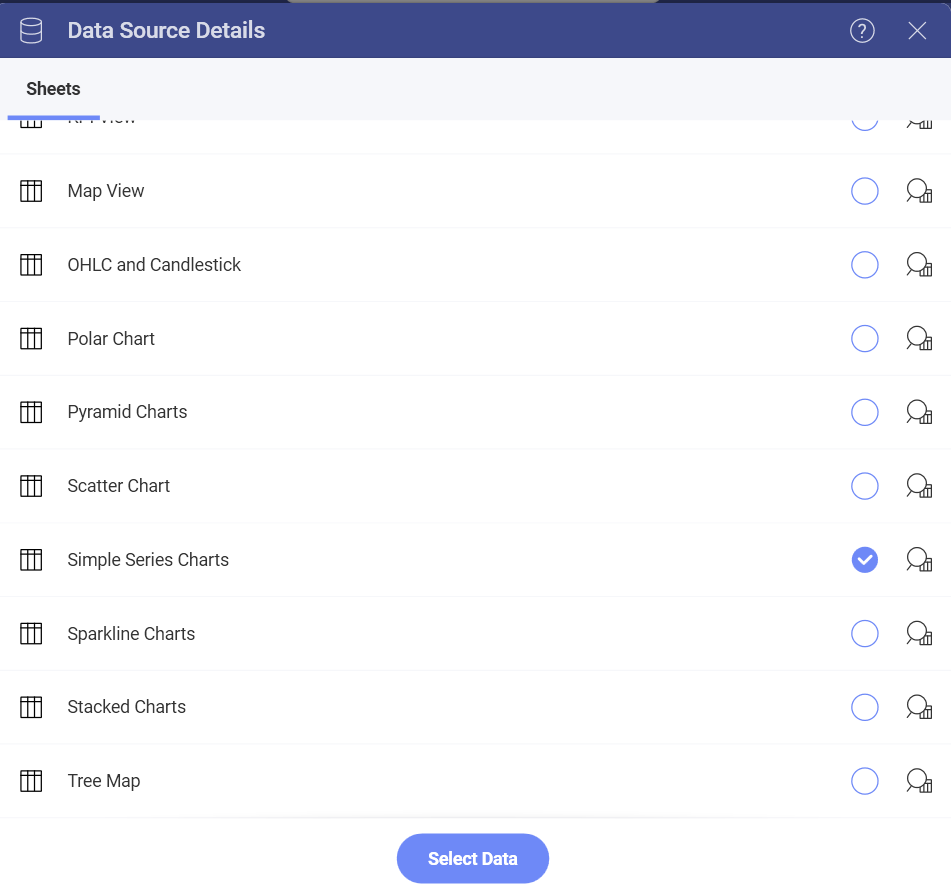
Once the data source is configured, select the Slingshot Tutorials Spreadsheet. Then, choose the Simple Series Charts sheet.
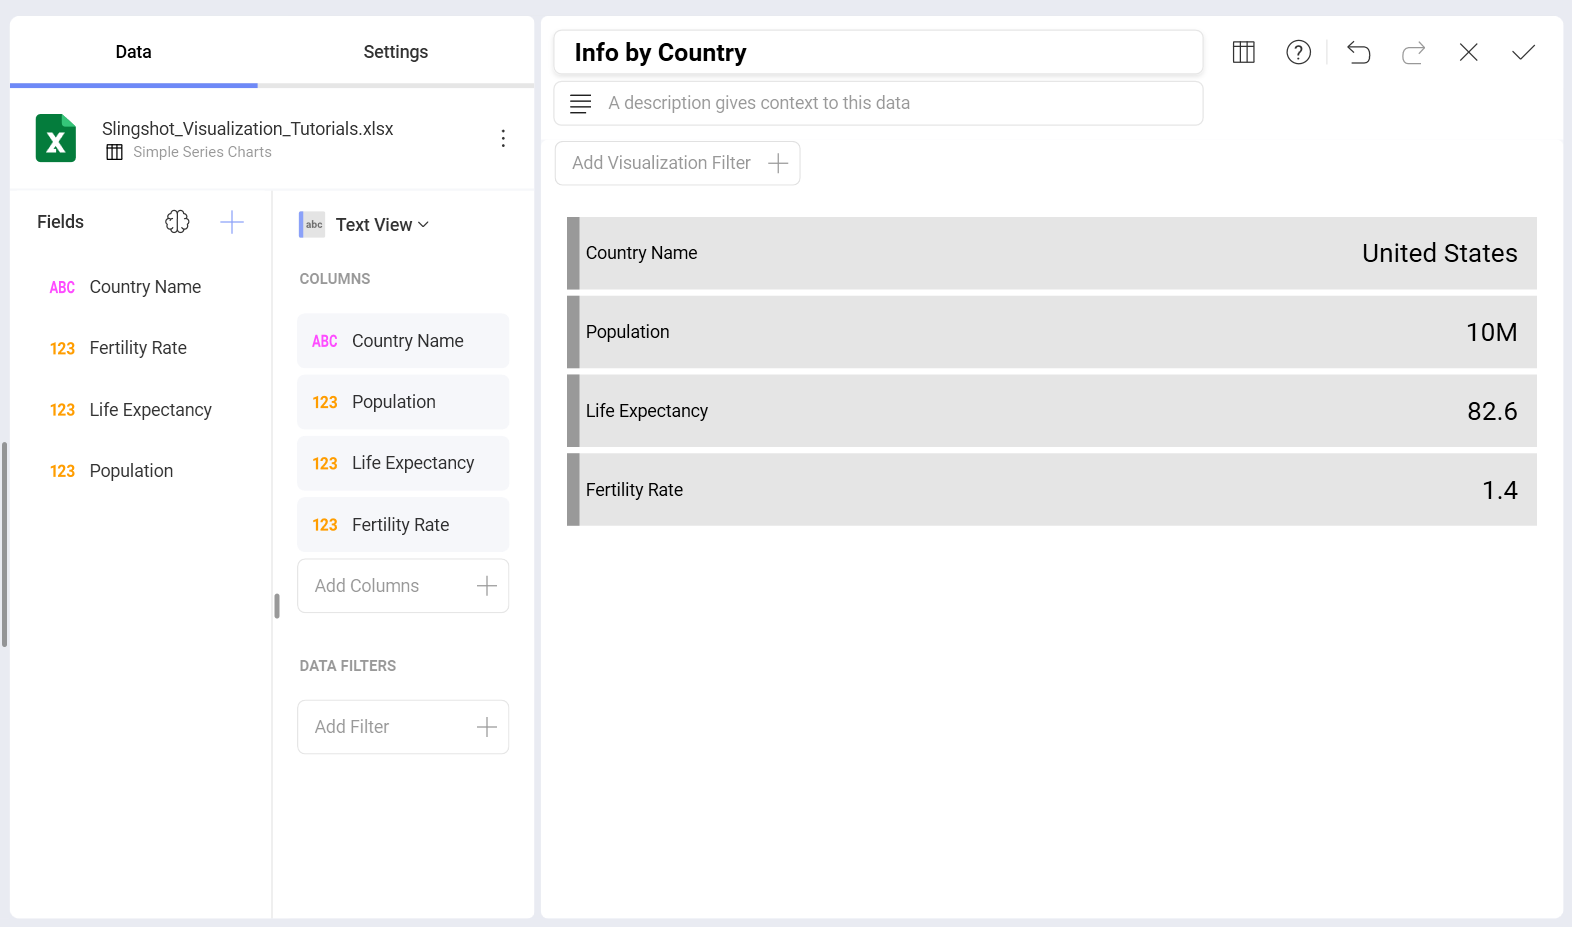
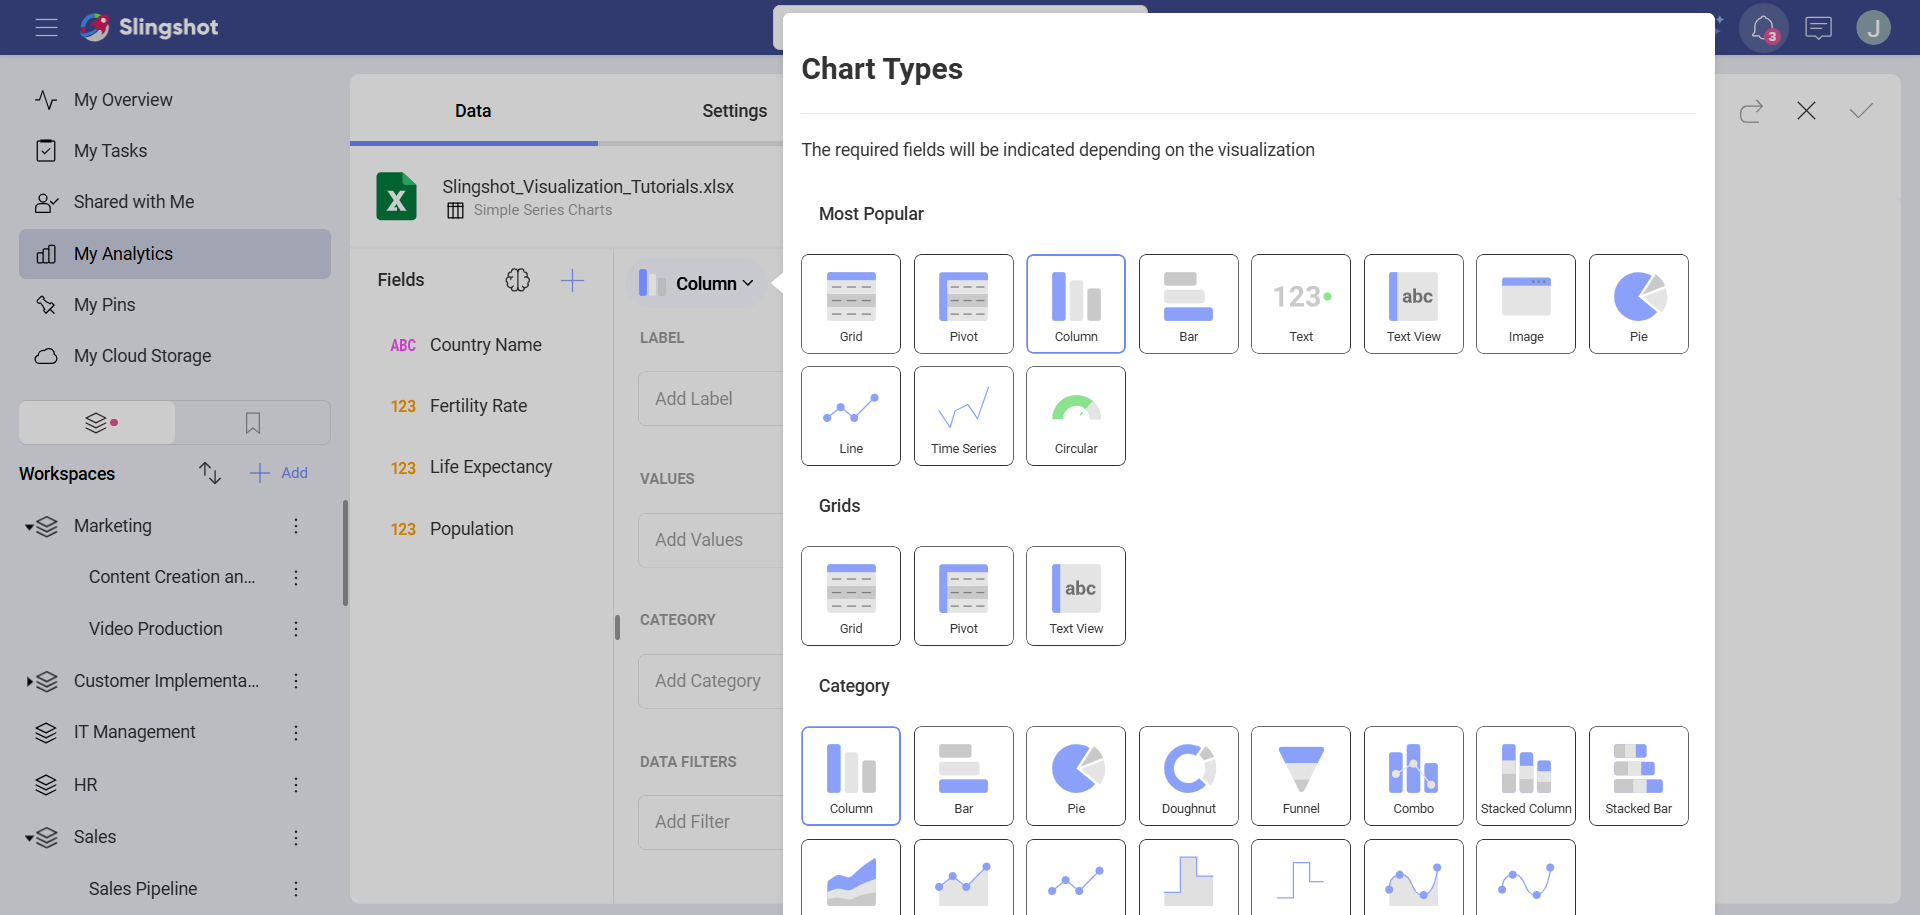
Open the Visualization Picker and select Text View. By default, the visualization type will be set to Column.
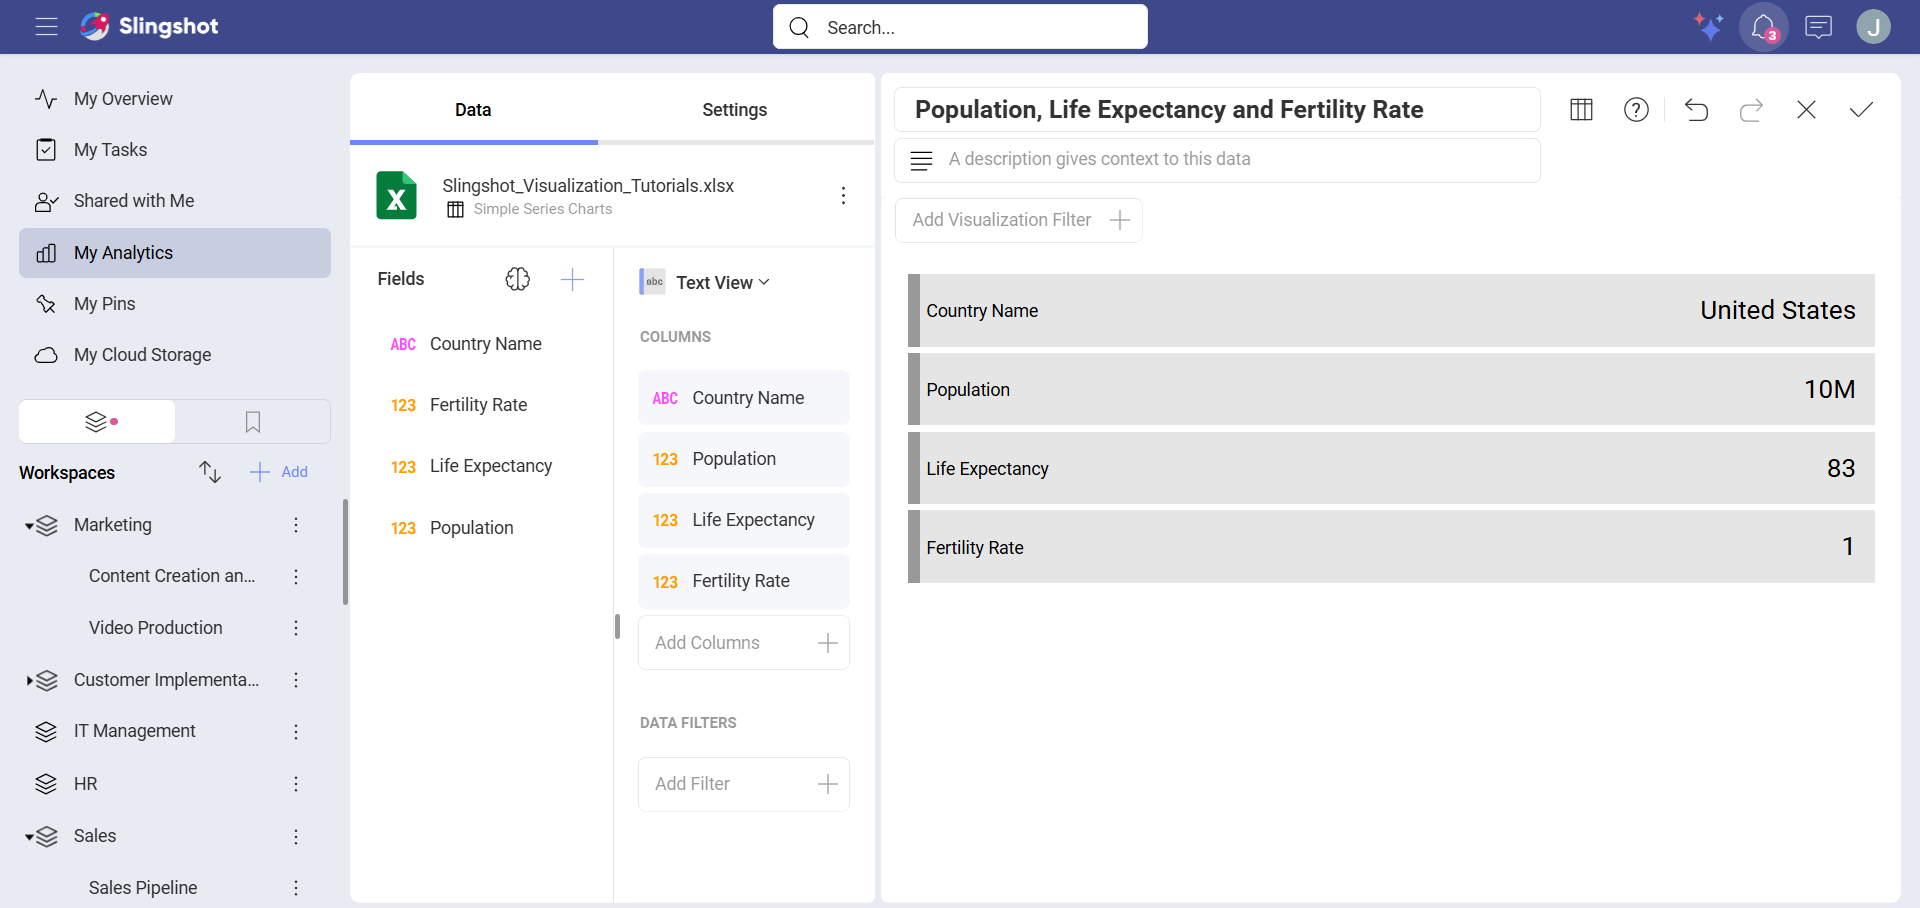
The above text view, for example, displays the Population, Life expectancy and Fertility rate for a specific country. Drag and drop Country Name, Population, Life Expectancy and Fertility Rate into Columns.
Changing the Selected Row
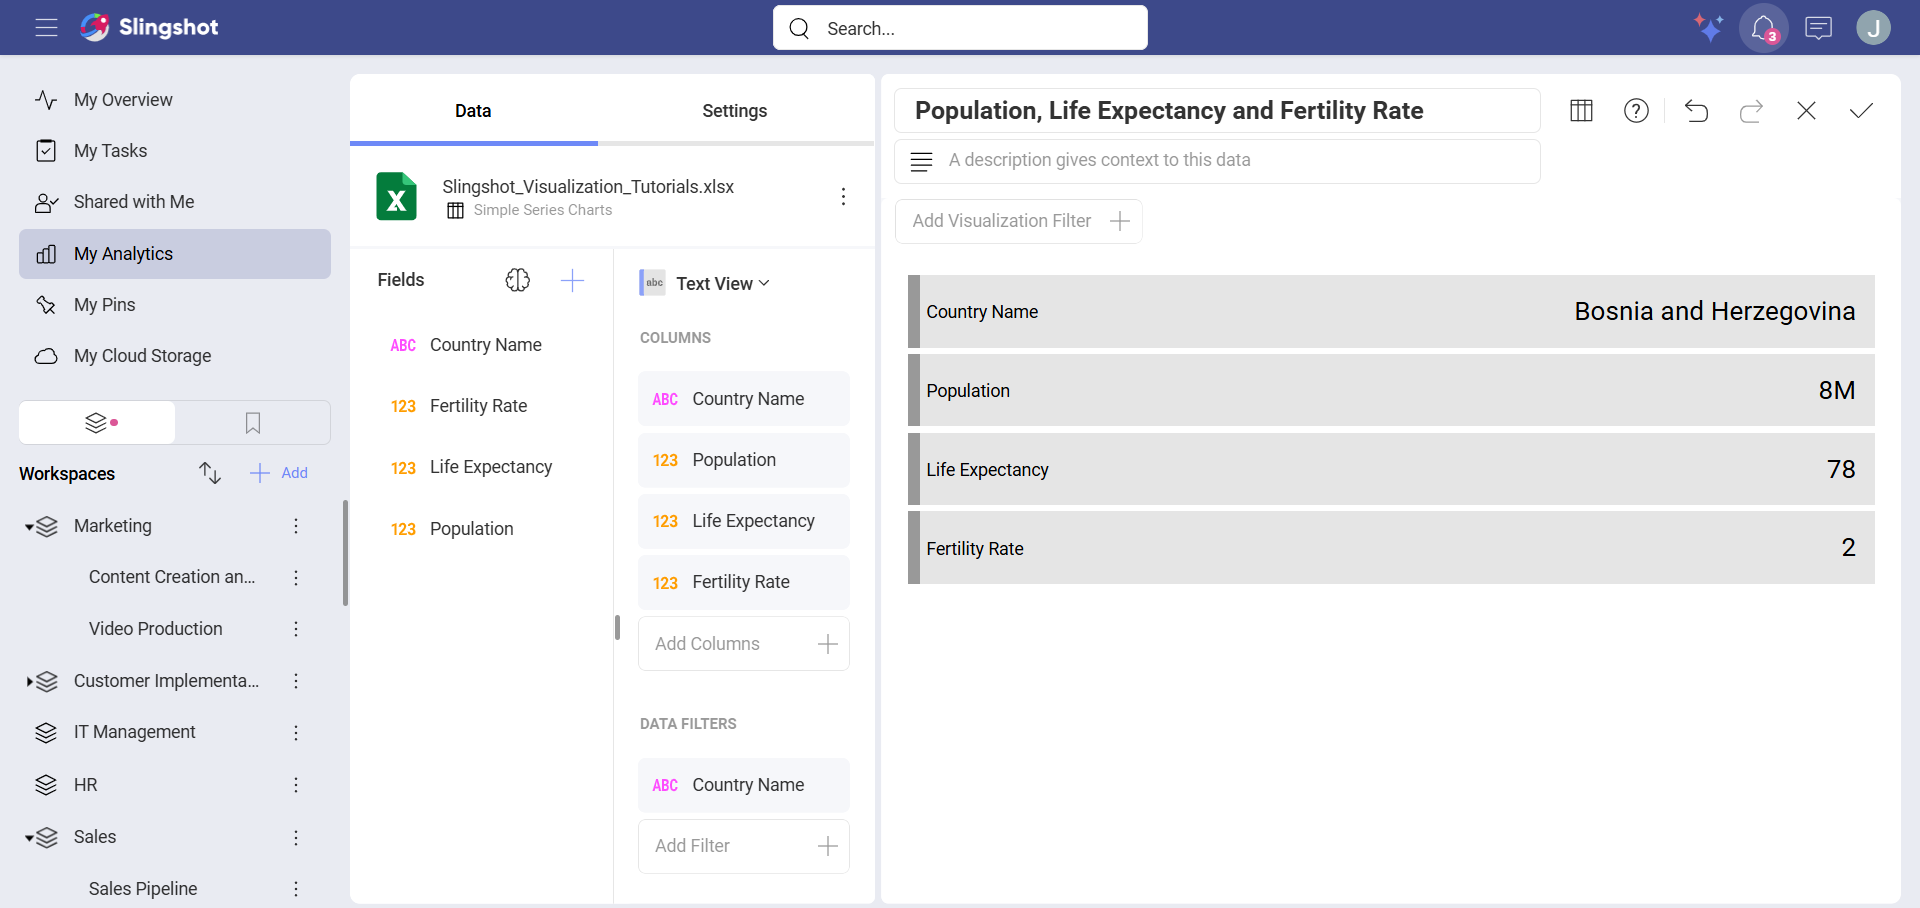
Text View displays the first row of the sheet by default. You can add a filter to your data in order to change this. For example, let's make the text view display row 9 (Bosnia and Herzegovina).
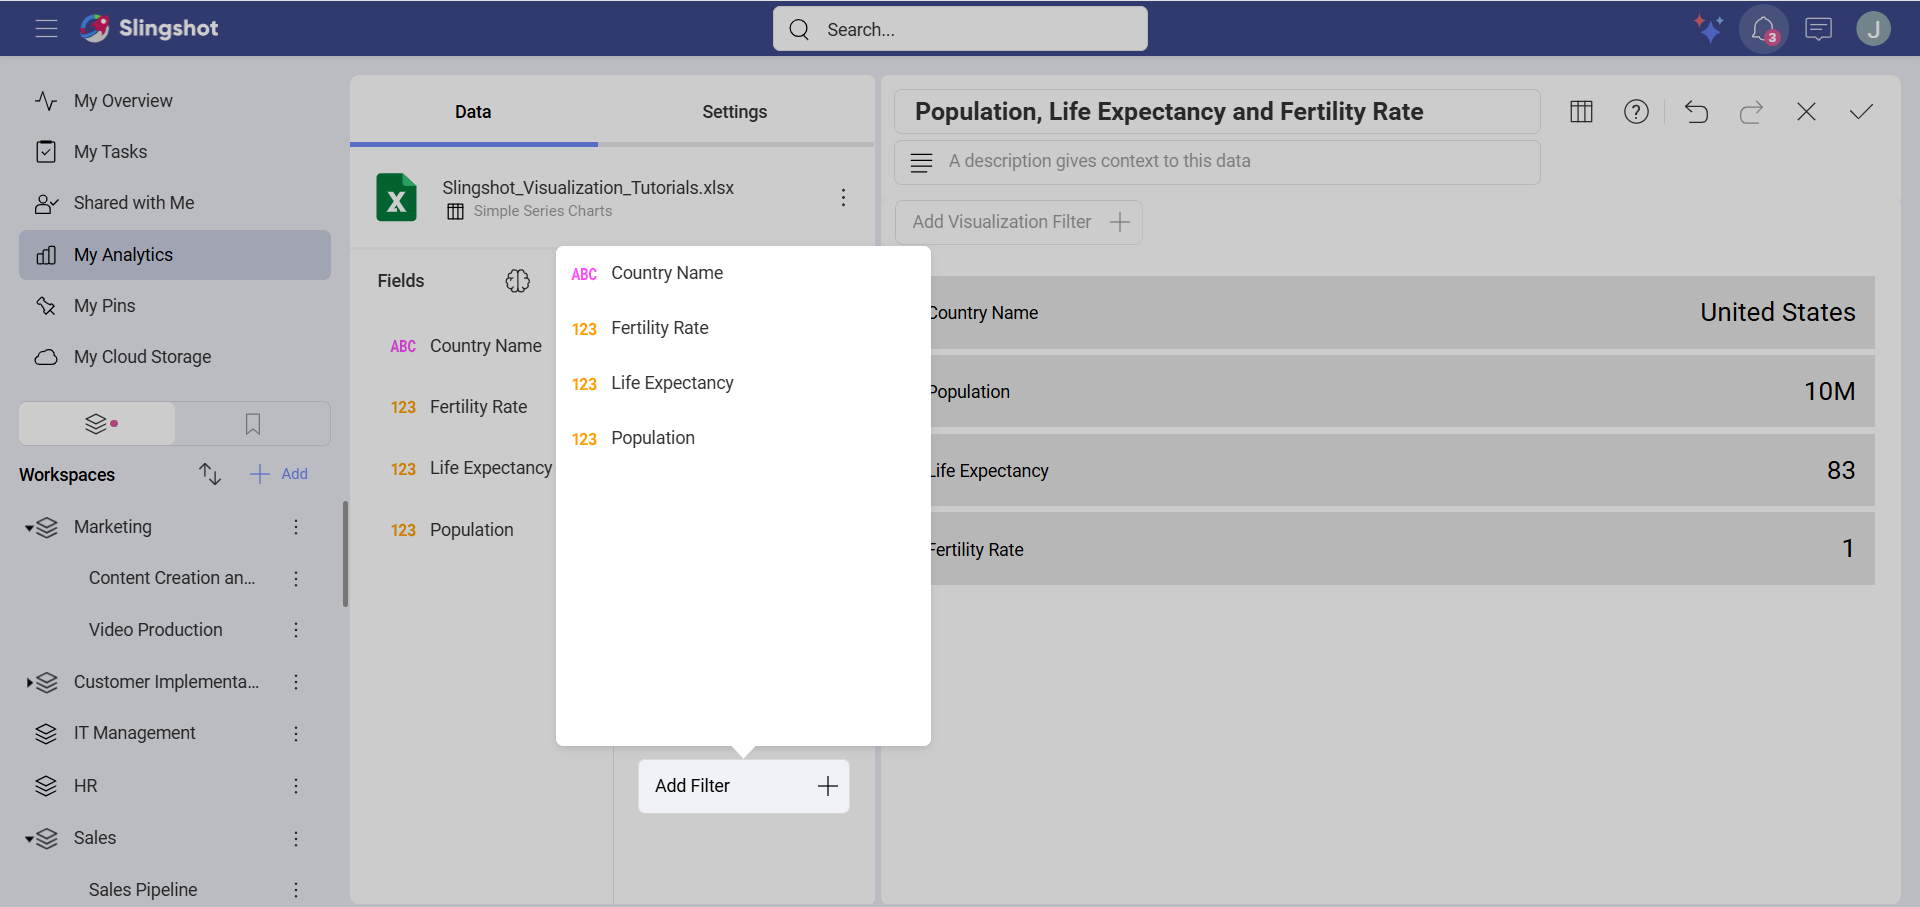
Drag and drop the Country Name field into Data Filters.
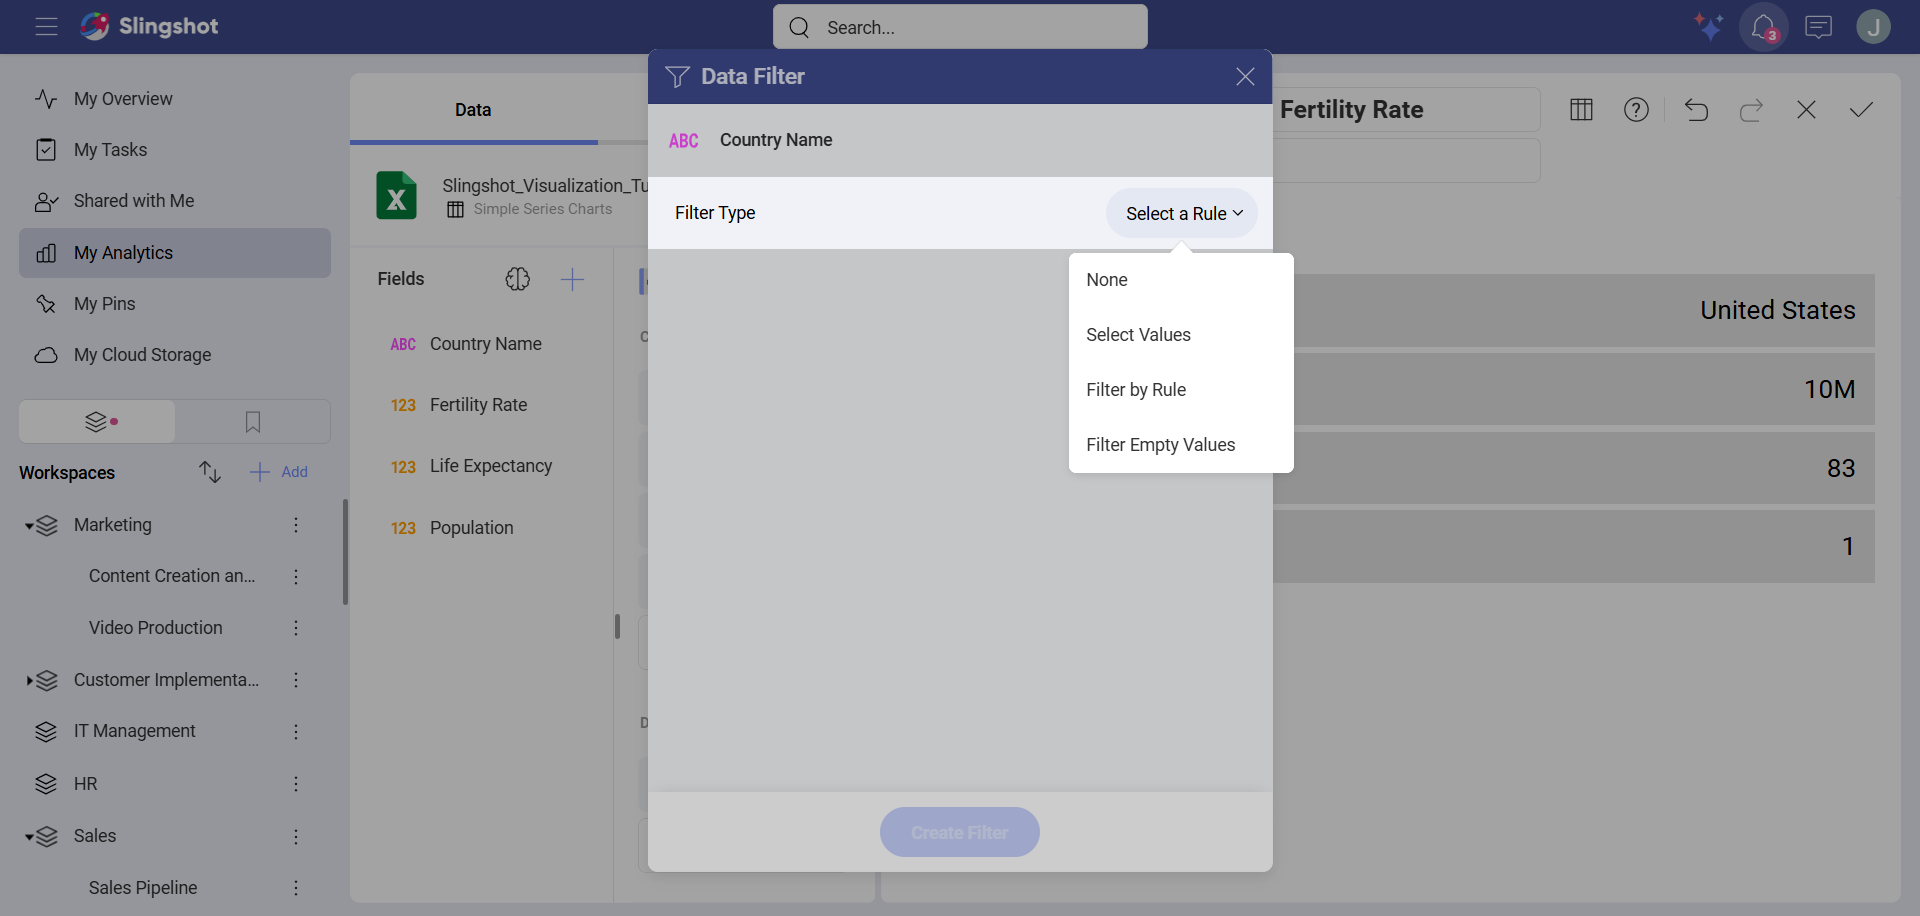
Select Filter Type to enable the dropdown menu and then choose Select Values.
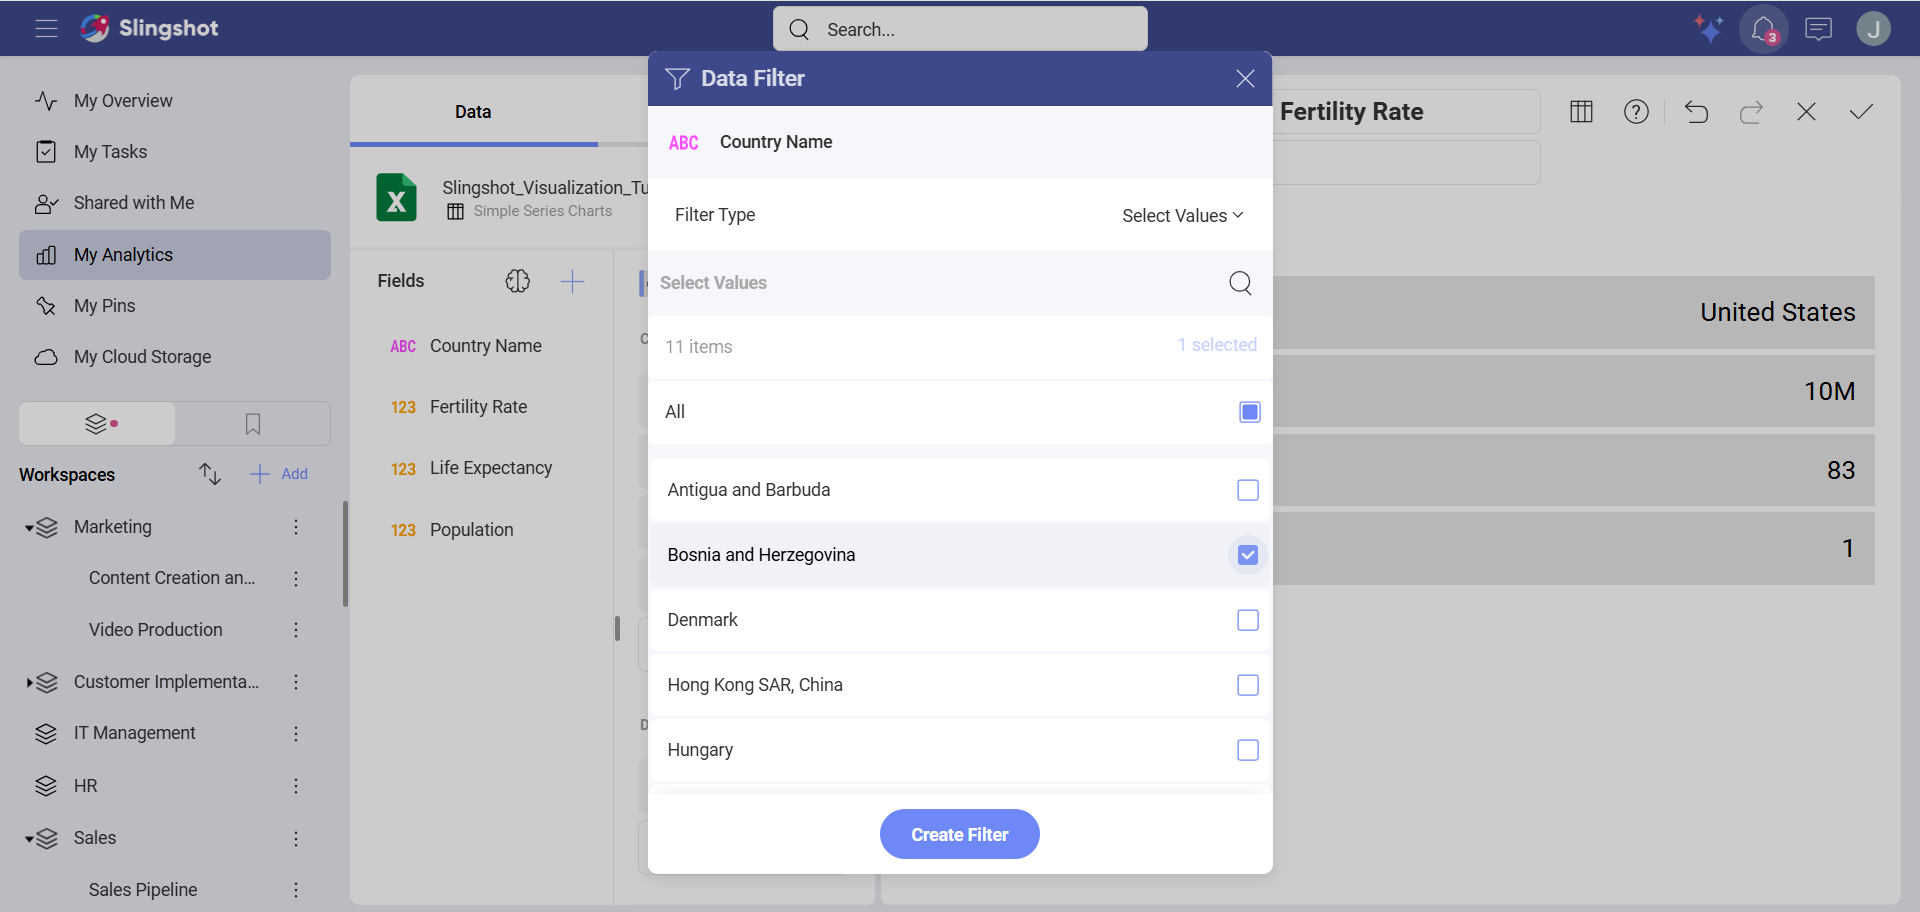
By default, all values will be selected. Uncheck the All box and select only Bosnia and Herzegovina. Then, select Create Filter.
The visualization will be updated to reflect the changes.