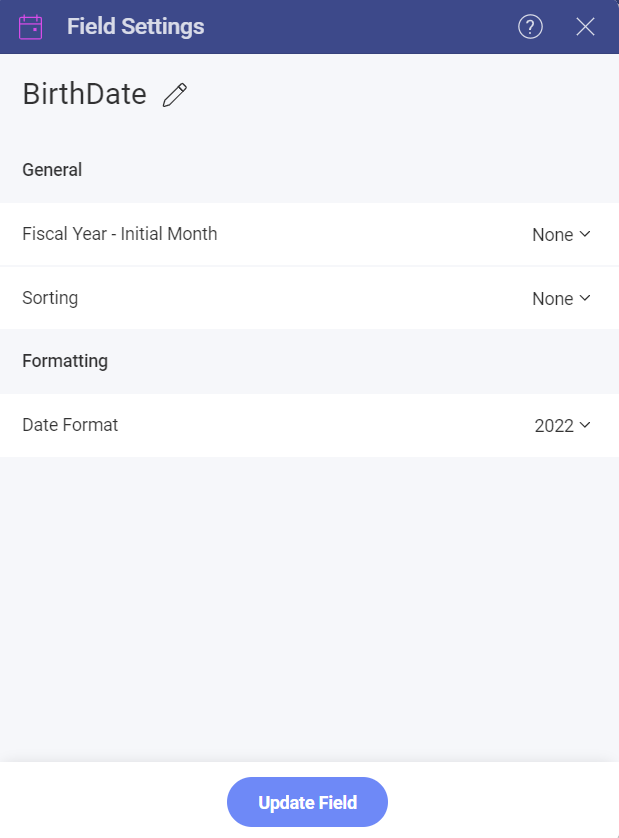
Field Settings
This section describes the different options for applying transformations to datasets, such as sorting, filtering, and aggregating data.
In order to apply formatting or filter to your data, you must select the specific field you want to modify in the corresponding placeholder (Category, Columns, Label, Rows and Values). There are three types of fields, each of which has their own formatting and filter options:
[!NOTE] All fields dropped in the Values placeholder of the data editor will be formatted as numbers.
Date Fields
Label renaming: rename your fields for display purposes only. Fields are always referenced by their original name in calculated field expressions. Once renamed, erase the label completely to go back to the original value.
Fiscal year initial month: if your 12-month period is not the same as a calendar year, you can use Fiscal Years and select the initial month for your period.
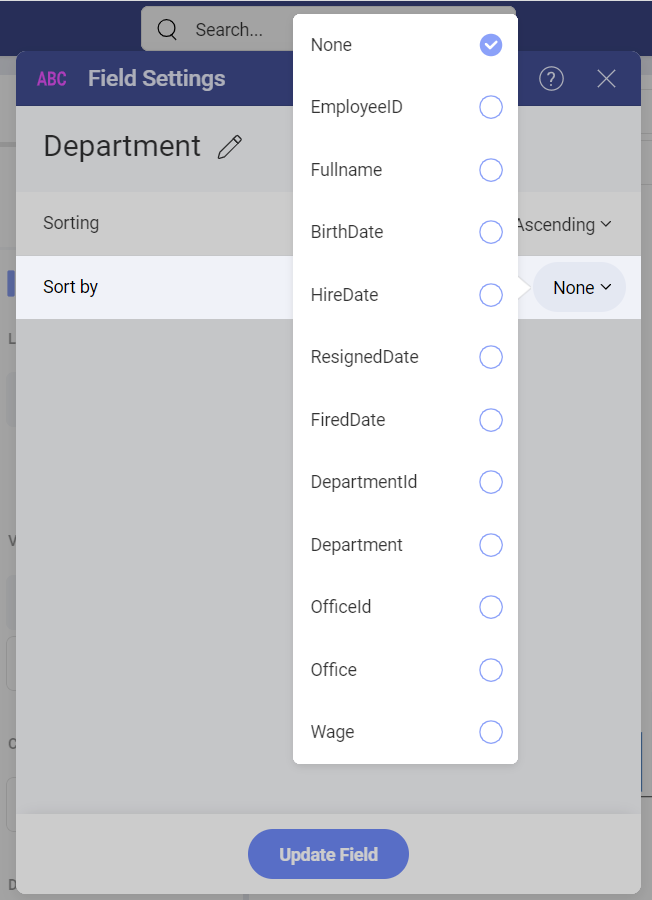
Sorting: sort your dates in either ascending or descending order.
Date Format: select from a predefined list of date and time formats to display your date/time values.
Date Fields Hierarchies
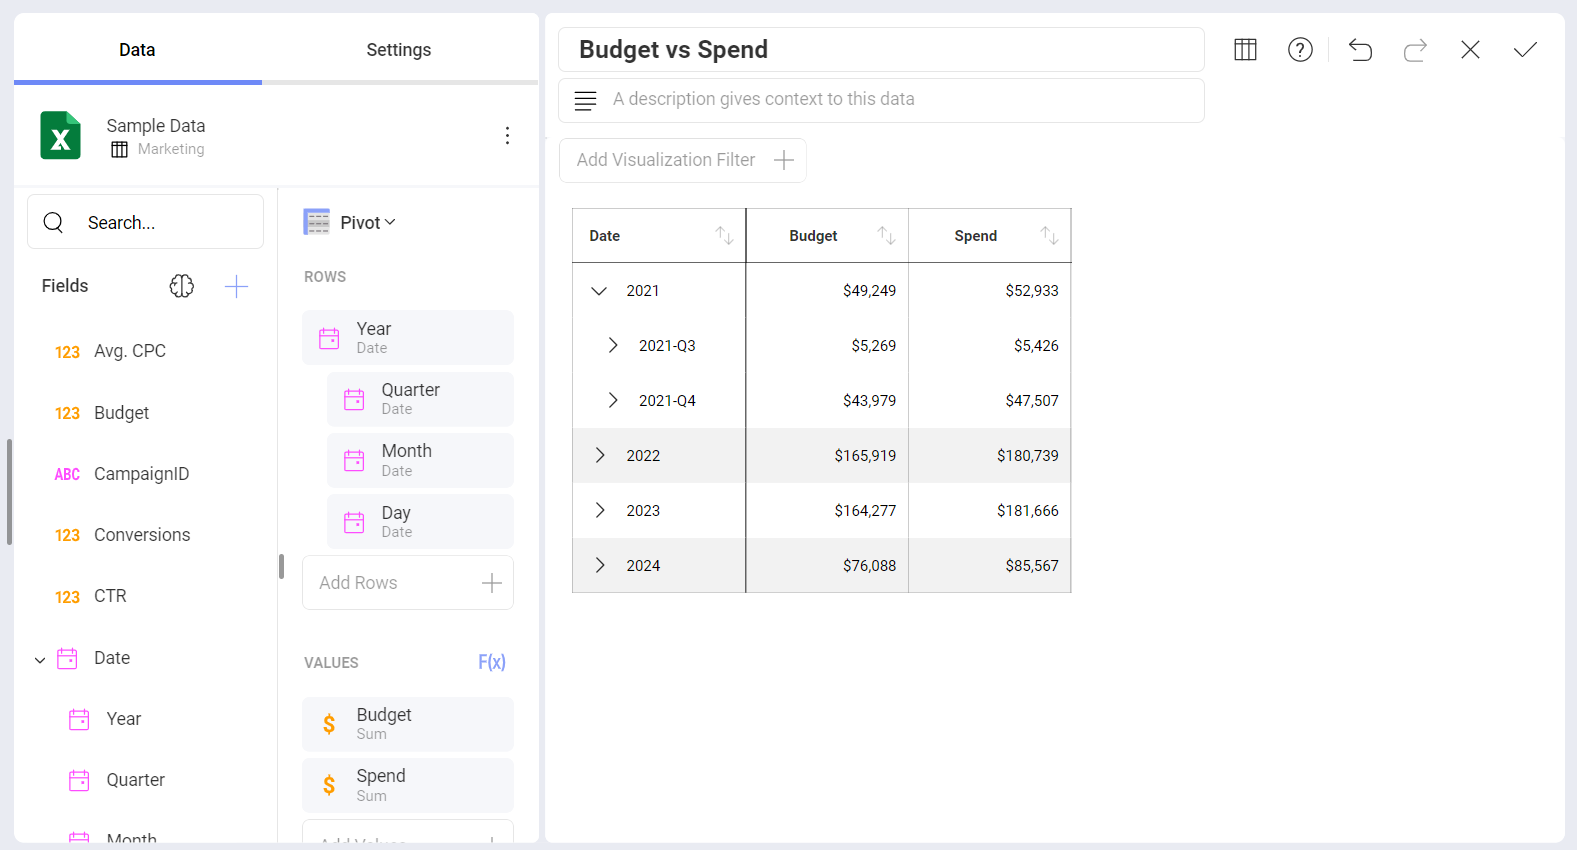
Date Fields aggregation is displayed as a hierarchical list in the Fields section. You can find Year, Quarter, Month, Day, and Minutes, depending on the level of granularity of your Date field.
When you drag and drop a Date field in the Pivot Editor, all the hierarchy is automatically displayed (see below).
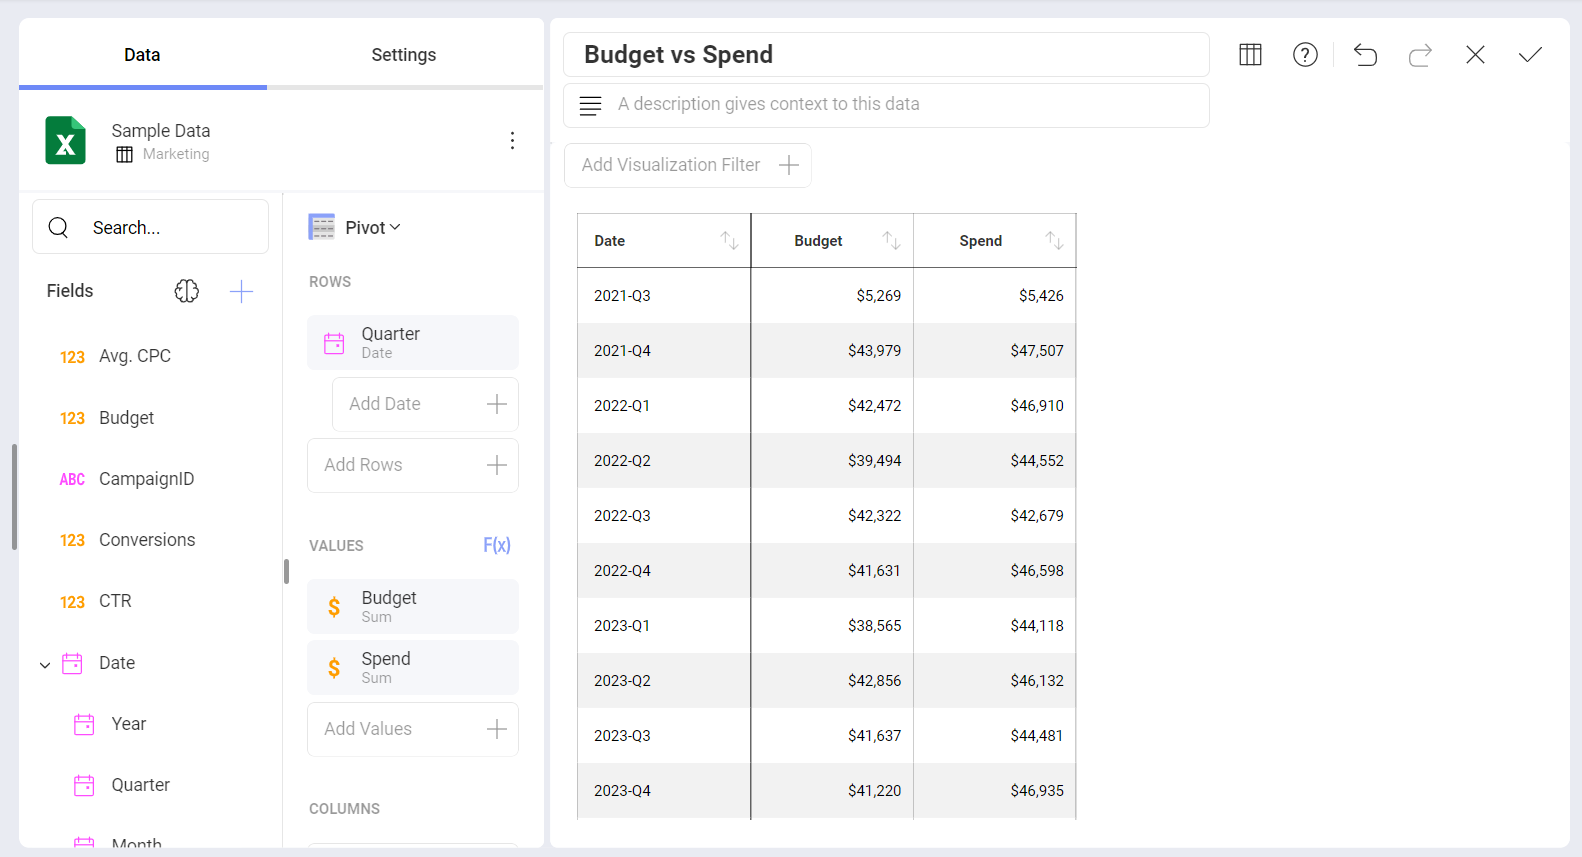
In addition, dragging a specific hierarchy level will show data for that level only, as shown below.
Numeric Fields
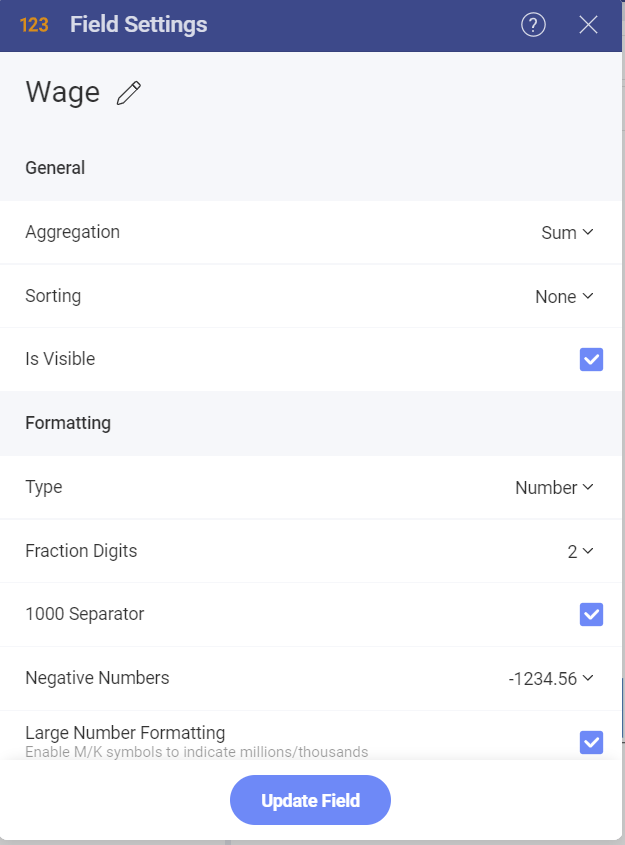
Label renaming: rename your fields for display purposes only. Fields are always referenced by their original name in calculated field expressions. Once renamed, erase the label completely to go back to the original value.
Aggregation: configure how you want your numbers to be processed by Analytics (sum, count, average, etc.).
Sorting: sort your numbers in either ascending or descending order.
Is Visible: choose whether the data in this field will be used in the current visualization.
Type: define whether your number should be formatted as percentage, currency, or a simple number. If you select Currency, you will have the option to choose the type of currency (dollar, euro, pounds, and yens).
Fraction digits: select the number of decimal places you want to display.
Negative Numbers: select between enclosing negative numbers in parentheses or prefixing with the minus (-) sign.
Large Numbers Formatting: display M for millions and K for thousands within the visualization preview in the central pane.
1000 Separator: configure whether or not to display the thousands separator.
Conditional Formatting: when enabled, this allows you to provide different formats to each of your cells depending on their values. For instance, values in the lower 50% range of a field can be colored with a red adorner to signal a problem. You can establish styling rules up to three ranges (typically used for upper, middle, and lower ranges), but you can customize your limits, type of comparison, colors, and indicator symbols.
String Fields
Label renaming: rename your fields for display purposes only. Fields are always referenced by their original name in calculated field expressions. Once renamed, erase the label completely to go back to the original value.
Sorting: sort your dates in either ascending or descending order.