Conditional Formatting
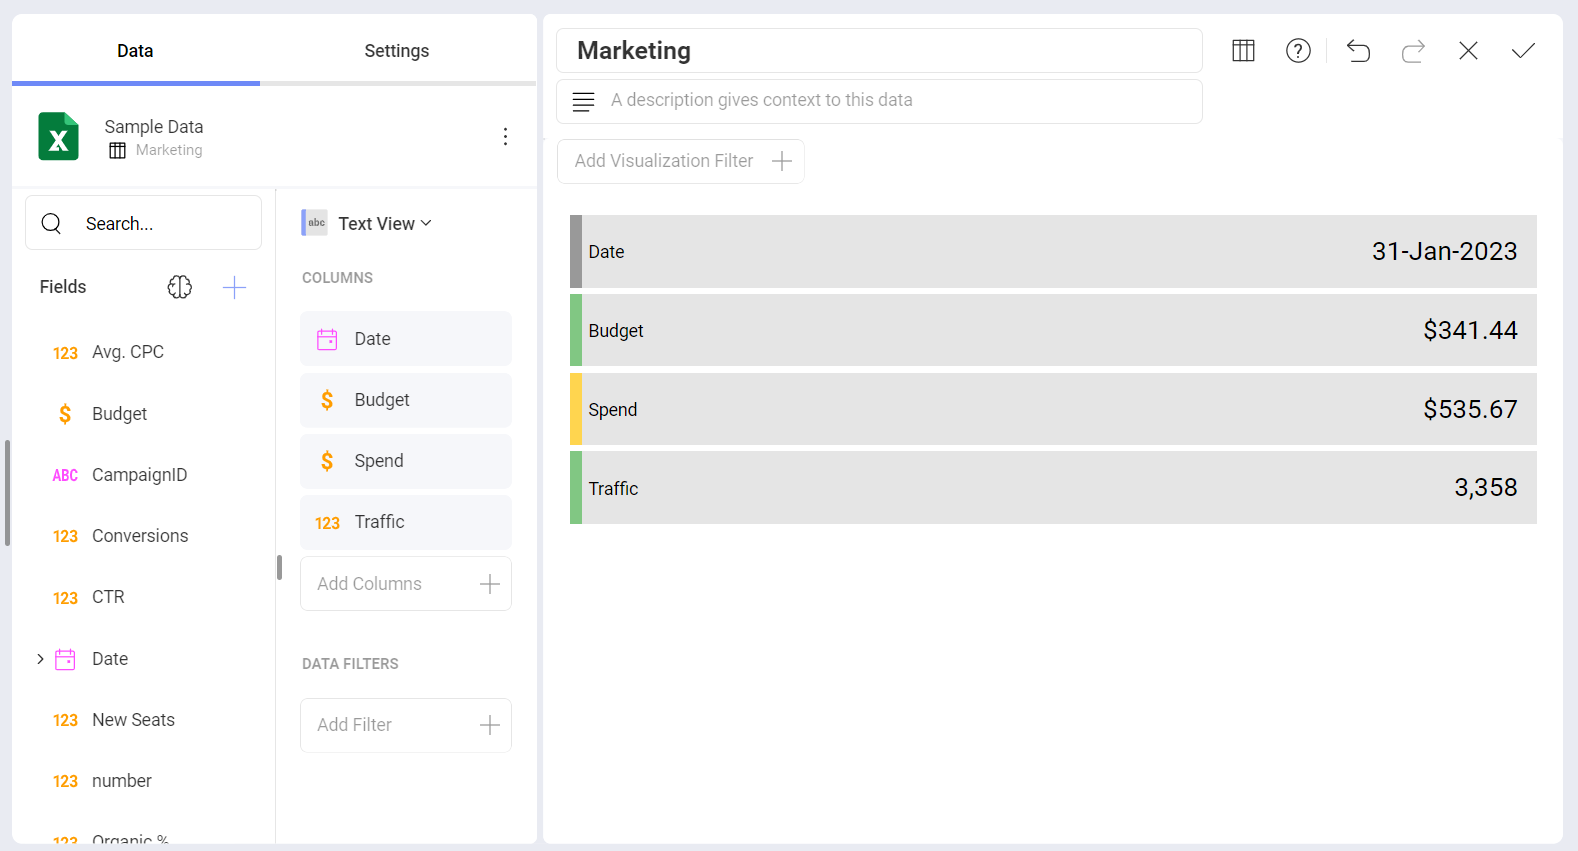
Conditional formatting allows you to provide different formatting of a cell (or rows for Text Views) depending on the values found in a numeric column. For instance, values in the lower 50% range of a grid can be colored with a red adorner to signal very low values.
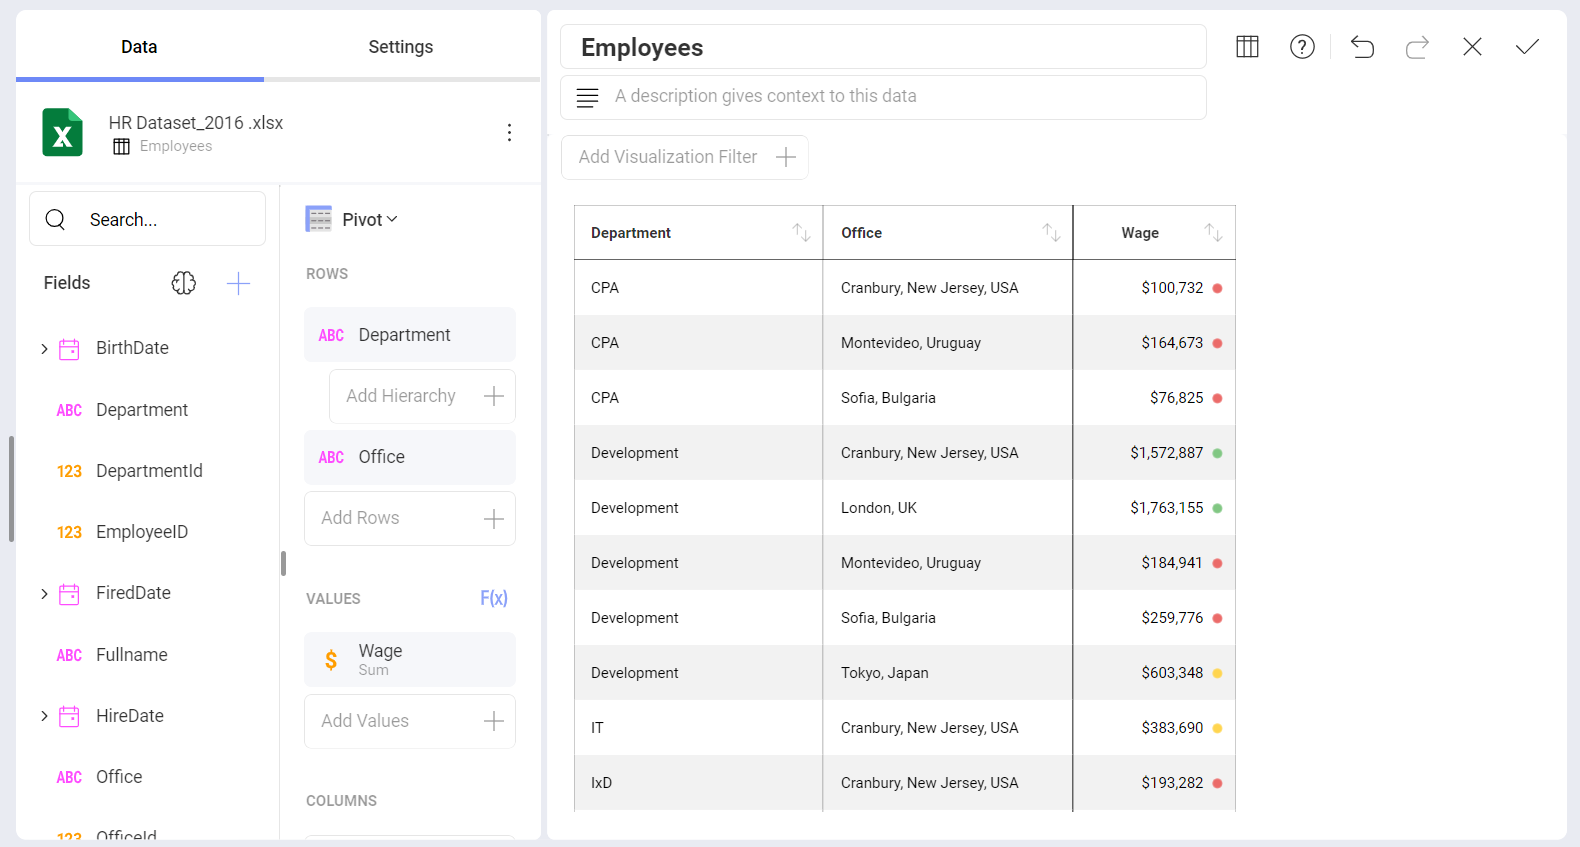
The conditional formatting configuration allows you to establish styling rules per ranges of data up to three ranges (typically used for styling, upper, middle, and lower ranges). Depending on the nature of the information, low values might be a good or bad signal, so you have the flexibility to configure the styling in the way that makes the most sense in your situation.
Enabling Conditional Formatting
To enable conditional formatting on a numeric column, select field in the Data Editor to prompt the Field Settings dialog. The conditional formatting configuration is the last option in the settings, and is disabled by default.
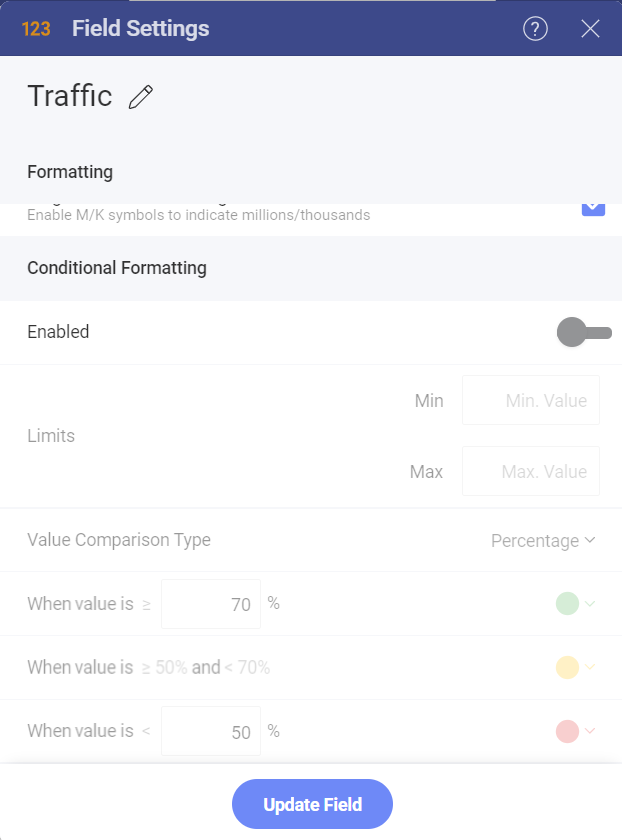
Limits: these values are automatically set as the lowest and highest values in the dataset for the specified column, but can also be overridden manually with constant values.
Data Ranges: the three ranges you will use to style your data. For all ranges, you can select one of the pre-defined indicators and colors in the drop-down.
Value comparison type: whether you want the ranges to be percentages or numbers.
When value is ≥: the formatting for values greater than the number you enter.
When value is ≥ and <: this is a fixed range that depends on the values you enter in the first and third range.
When value is <: the formatting for values less than the number you enter.
Supported Visualizations
Conditional formatting can be applied to the following visualizations:
Note
KPI, Linear, Circular, Text, and Bullet Graph gauges support conditional formatting in the form of visualization band range configurations.