Scatter and Bubble Charts
What are Scatter Charts Used for?
Scatter charts are used to represent the relationship between two quantitative measures by plotting data points along the X (horizontal) and Y (vertical) axes. They are particularly useful for demonstrating patterns in large datasets.
What are Bubble Charts Used for?
A bubble chart is a variation of a scatter chart in which the data points are replaced with bubbles. Like scatter charts, bubble charts represent the relationship between two quantitative measures as well as a third quantitative measure represented by the size of the bubble.
Creating a Scatter Chart
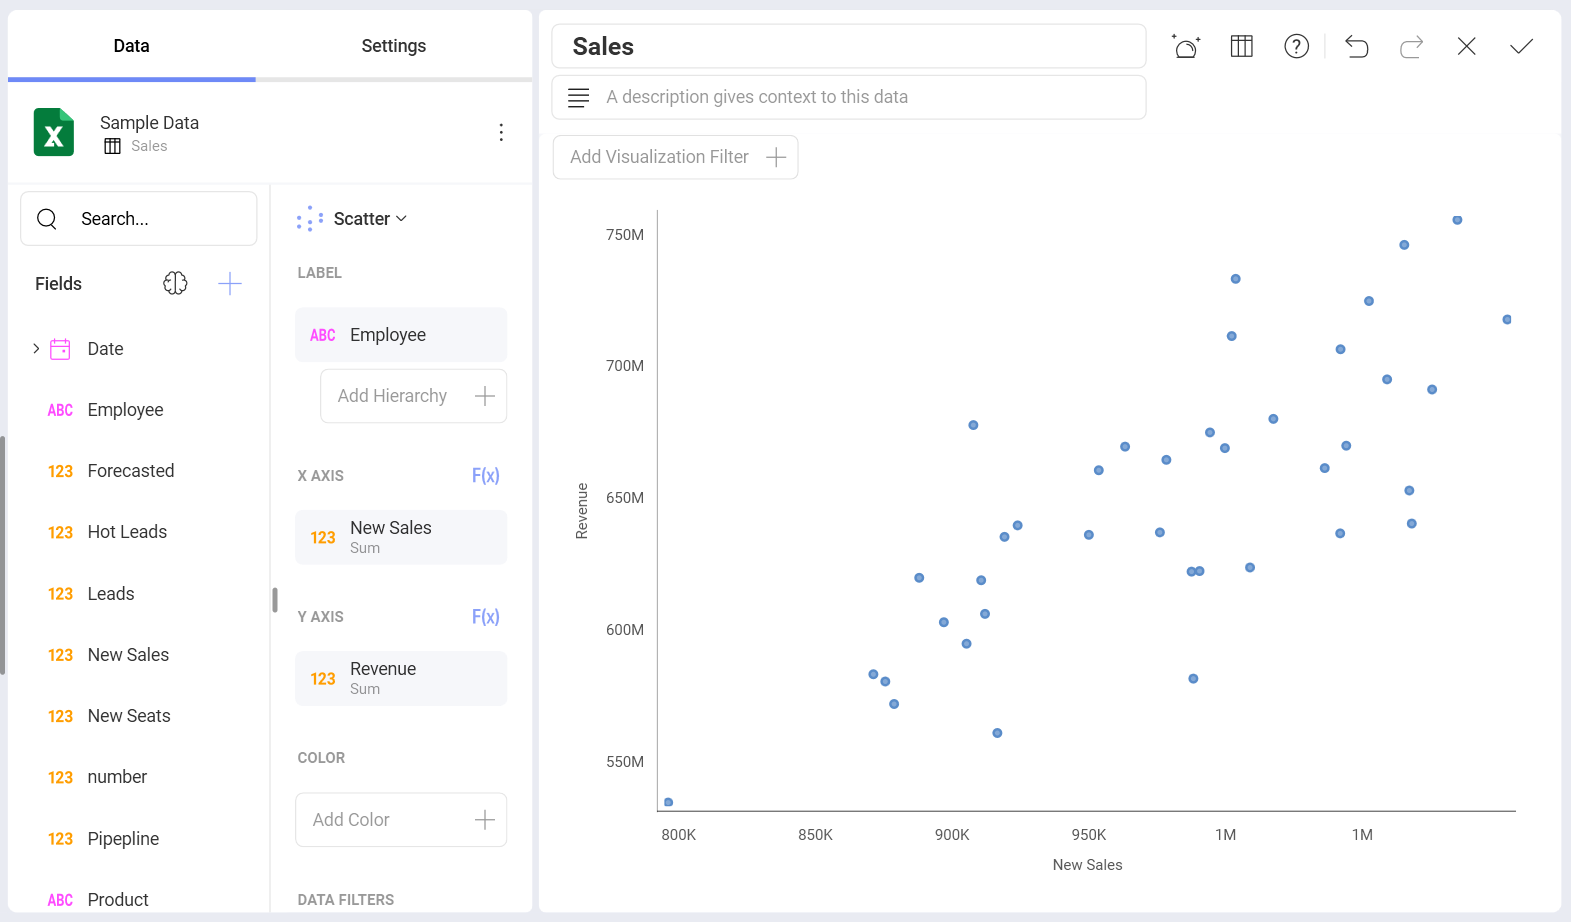
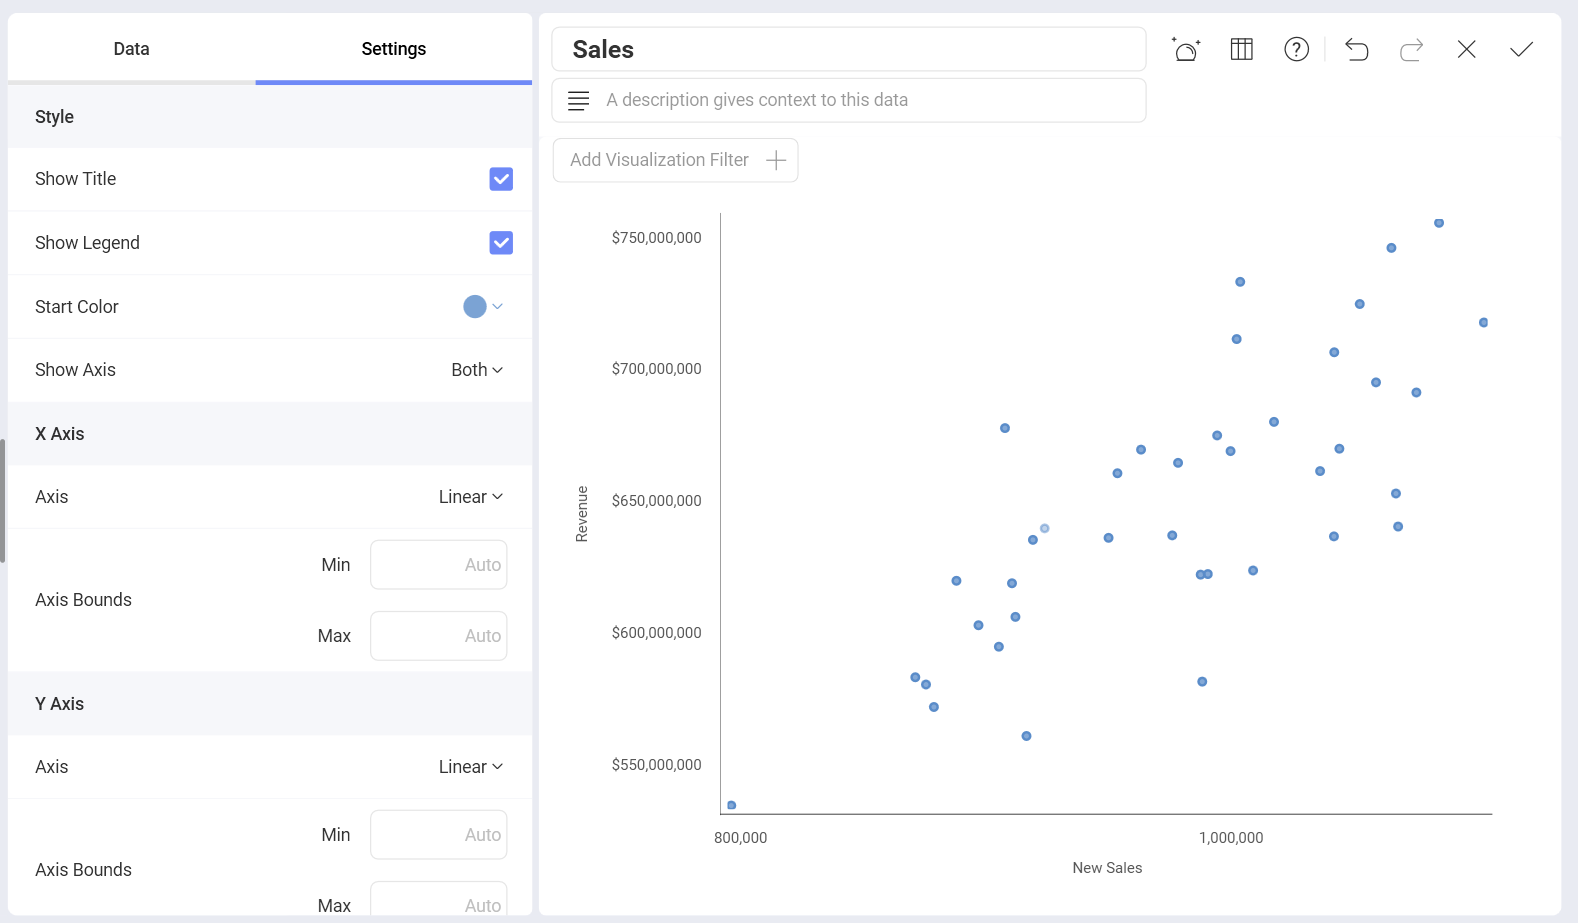
In the example above, the scatter chart visualization shows the relationship between the quantity of New Sales and the Revenue made by each particular Employee.
To create a scatter chart:
- Select the Scatter visualization from the list of chart types:
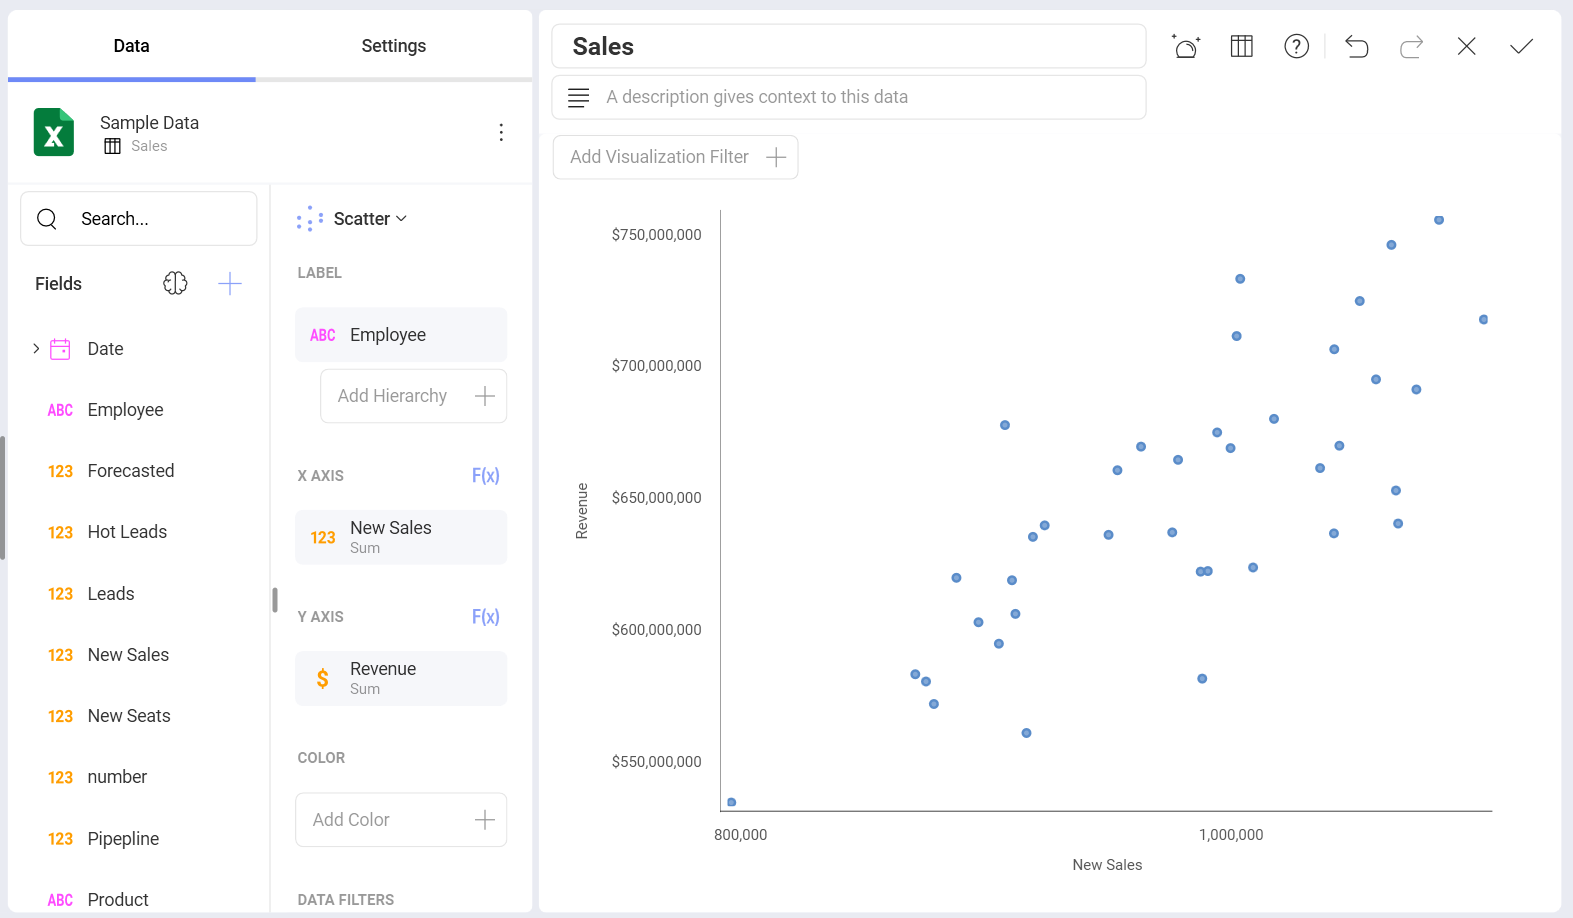
Choose numerical fields for the X axis and Y axis, which will determine the location of the data points.
Select a categorical value for your Label.
Every data point has its own tooltip, which shows up when you click on it:
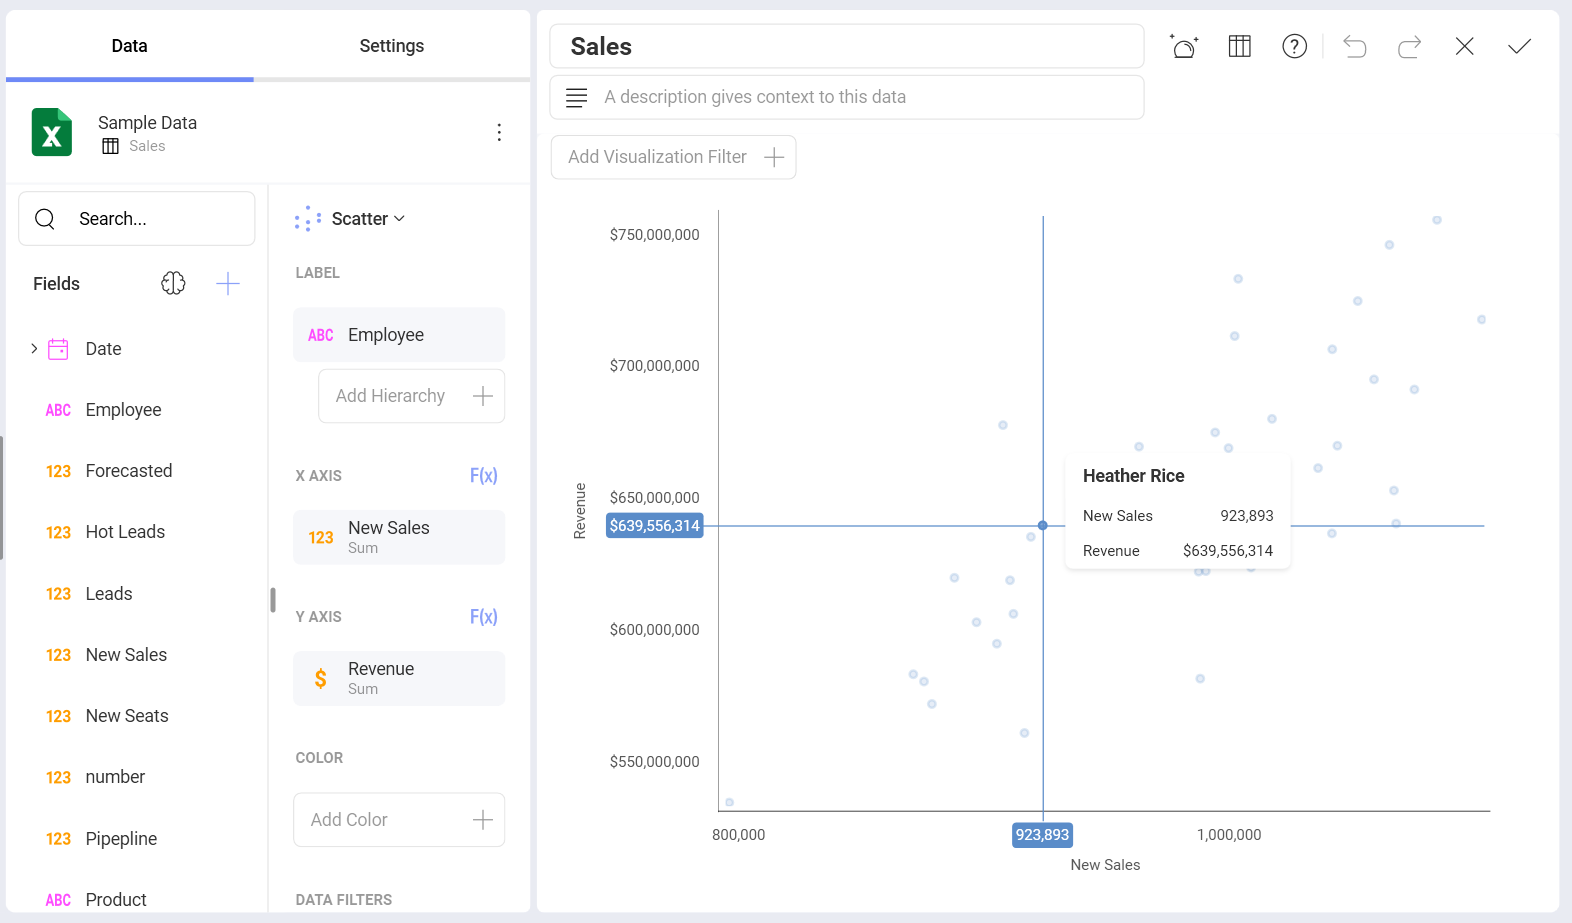
In this example, the tooltip gives information about a particular employee the data point represents, as well as quantitative data for them included in the chart.
Creating a Bubble Chart
To create a basic bubble chart, using only one color, you will need to:
Select Bubble chart from the list of Chart Types.
Choose numerical fields for your X axis and Y axis.
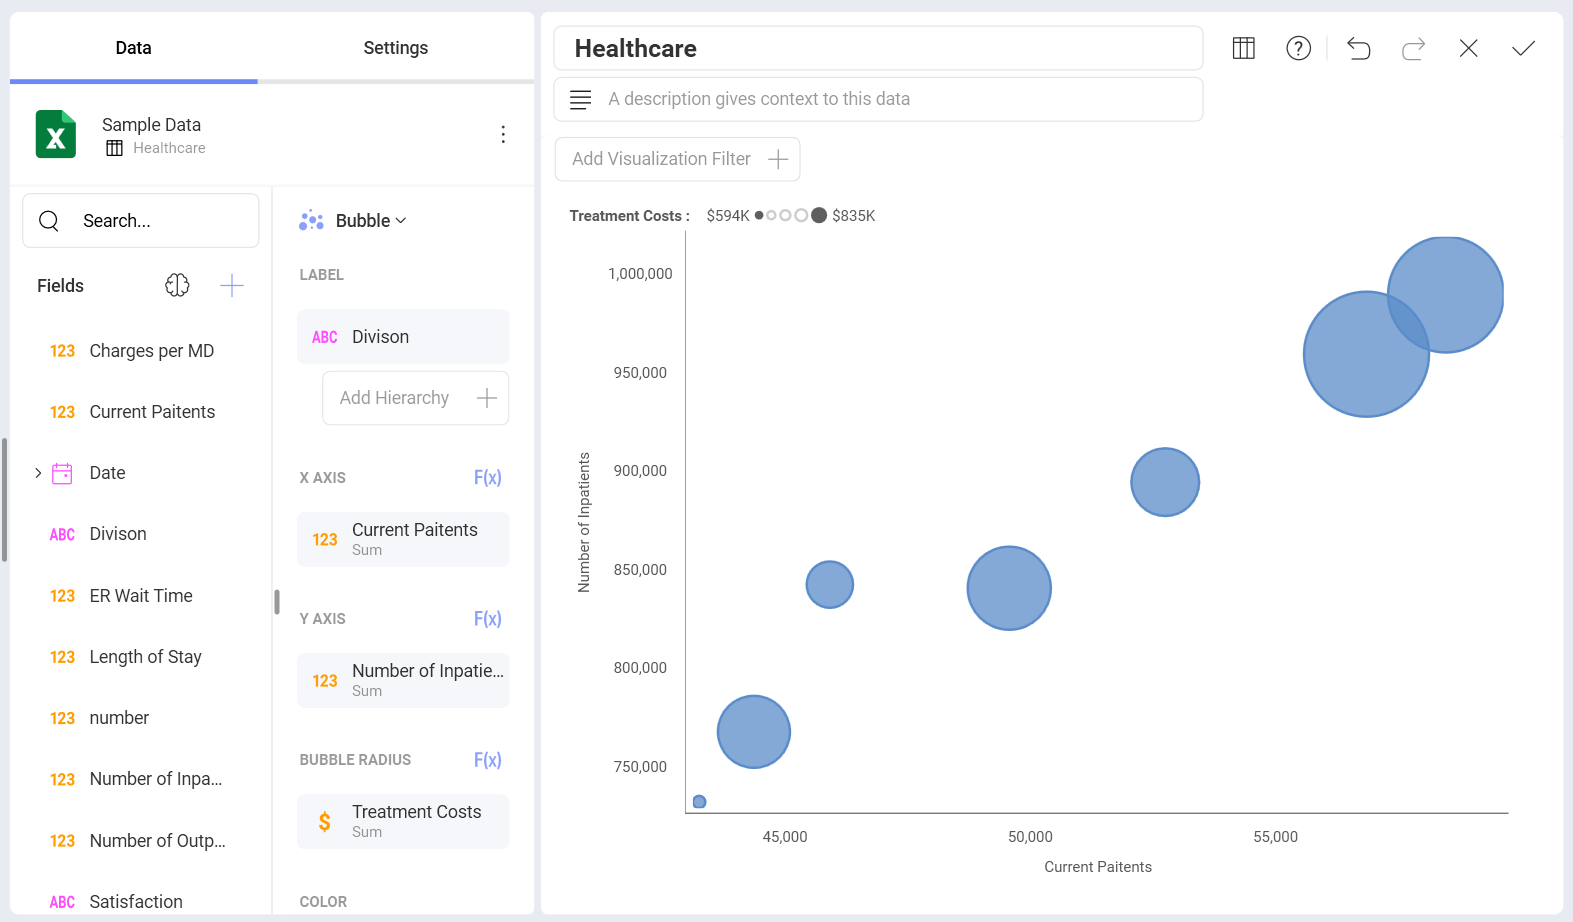
In the example above the location of the bubbles is determined by the correlation between the Number of Inpatients field and their Length of Stay in the hospital.
Select a categorical value for Label.
Each bubble in the shown chart represents a Division, such as Neurology, Cardiology, Surgery, etc.
Choose a numerical field for Bubble Radius.
You can see from the example that the size of each bubble depends on the sum of Treatment Costs in each Division. A legend on top of the chart shows the minimum and maximum value of the Bubble Radius field in the chart.
Clicking on the bubbles will also provide you with tooltips showing specific data for every particular bubble. If you have overlapping elements in your chart, click/tap on the smaller bubble to show its tooltip.
Adding the Color Category to Scatter and Bubble Charts
You can add a categorical field to the scatter or bubble chart. It will color the bubbles or scatter points in different colors depending on the values in this field.
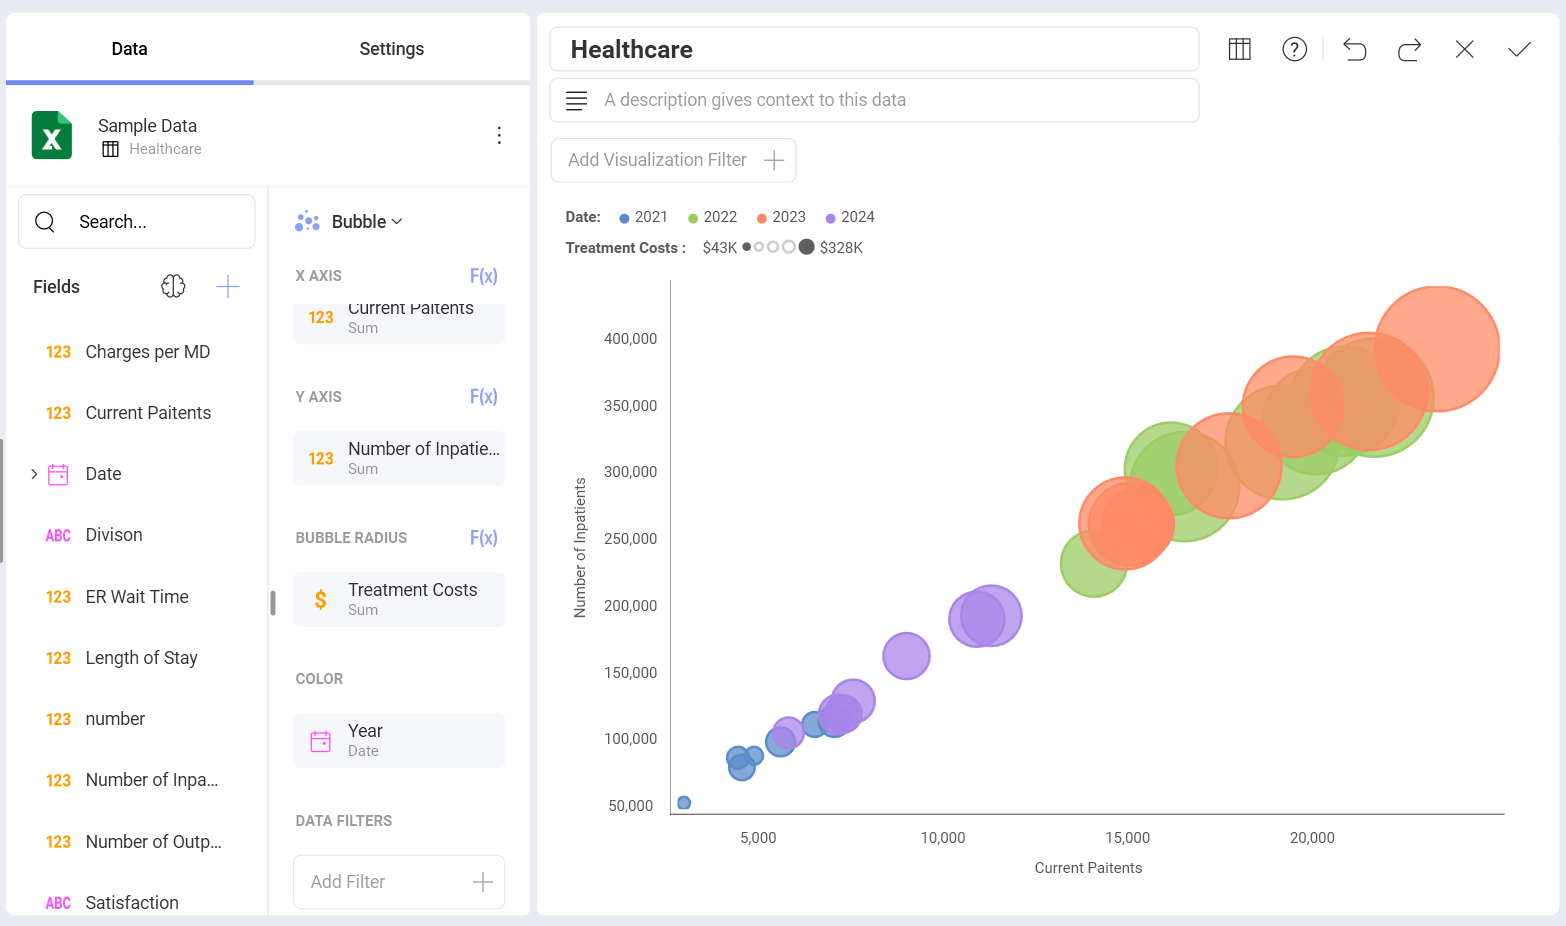
In the example above, the Date field is applied to the Color box. Adding the color category assigns different colors to the bubbles, depending on whether the numerical information for a division refers to 2021, 2022, 2023 or 2024.
This has also resulted in displaying more bubbles in the bubble chart visualization.
Settings for Scatter and Bubble Charts
In Settings you can:
Change the Style of your visualization.
You can select whether you want to show a Title or Legend for your visualization. Choosing a Start Color will define the color of the data points/bubbles. When more than one color is needed due to the use of the Color Category, colors are applied sequentially starting at the Start Color.
Choose between Linear and Logarithmic scale for the X and Y axis.
With Logarithmic, the scale for your values will be calculated with a non-linear scale which takes magnitude into account instead of the usual linear scale.
As a general rule, scatter charts are a better choice than line charts, when you want to use a logarithmic scale on the X-axis, since the horizontal axis of a scatter chart is always a value axis.
Set up the minimum and maximum values for your charts.
Minimum is set to 0 by default and maximum is calculated automatically depending on your values.