Statistical Functions in Analytics
Analytics's Statistical functions allow you to receive more insight from your visualizations. They provide you with three types of advanced predictive analysis. You can use the Time series forecast, Linear regression and Detect outliers to make predictions, recognize and evaluate trends, or discover outliers in your data series.
Accessing Statistical Functions
To apply one of the three statistical functions to your visualization you need to:
Open your dashboard in Dashboard view mode.
Maximize a visualization (by clicking the arrow icon in its top right corner).
Click/tap on the icon, which appears in the top right section of the screen (see below).
[!NOTE] Enabling/Disabling Functions.You can have only one of the three functions enabled for a visualization at the same time. Click the enabled function again to turn it off or select another function from the list to switch to.
Statistical Functions Types
The table below explains what every function is used for, the algorithm the function uses, and for which visualizations the function can be enabled.
| Function | Algorithm | What is it used for? | Which visualizations support it? |
|---|---|---|---|
| Time series forecasting | Exponential smoothing | To make a forecast of the data, for a given data series. Users can select a time range in the future. | Category charts: Area, Bar, Column, Line, Spline, Spline Area, Step Area, Step Line |
| Linear regression | Linear regression | To evaluate a trend by finding the linear relationship between two variables. The algorithm calculates a line, close to most of the points in the chart to show the on-going trend. | Category charts: Area, Bar, Column, Line, Spline, Spline Area, Step Area, Step Line |
| Detect outliers | Interquartile range rule | To detect data that stands out from the rest because of random factors. | Category charts: Area, Column, Line, Spline, Spline Area, Step Area, Step Line; Scatter chart |
Time series forecast
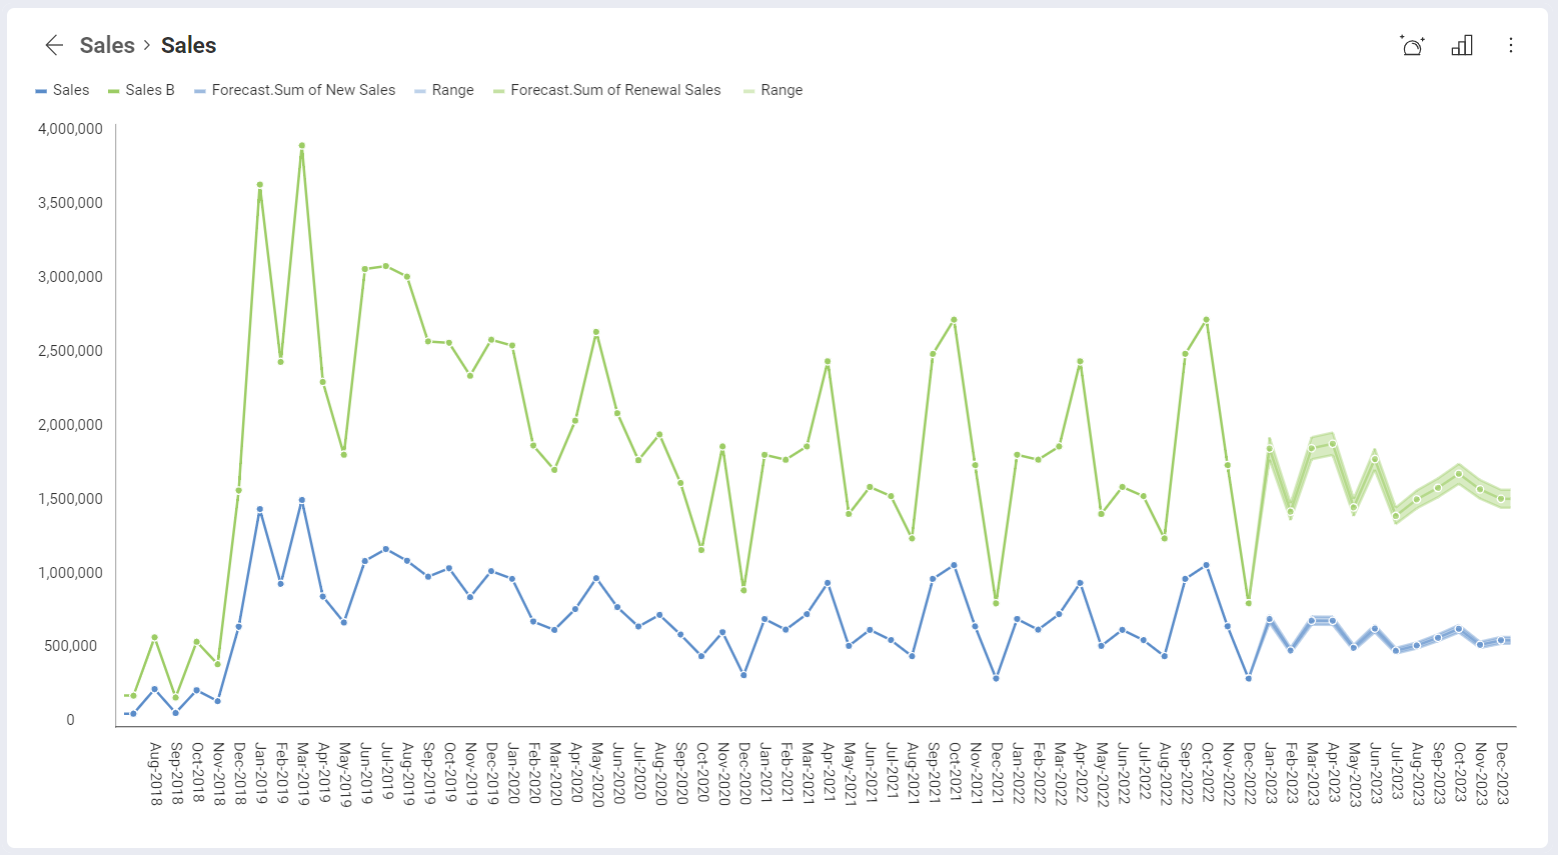
The Time series forecast function is used to provide prediction of the data for a given data series. In the example below, the function is used to provide a forecast of the sales of two products for the next 12 months.
To achieve the forecast shown above, perform the following steps:
Select Time series forecast from the Statistical Functions menu.
The following settings dialog opens:
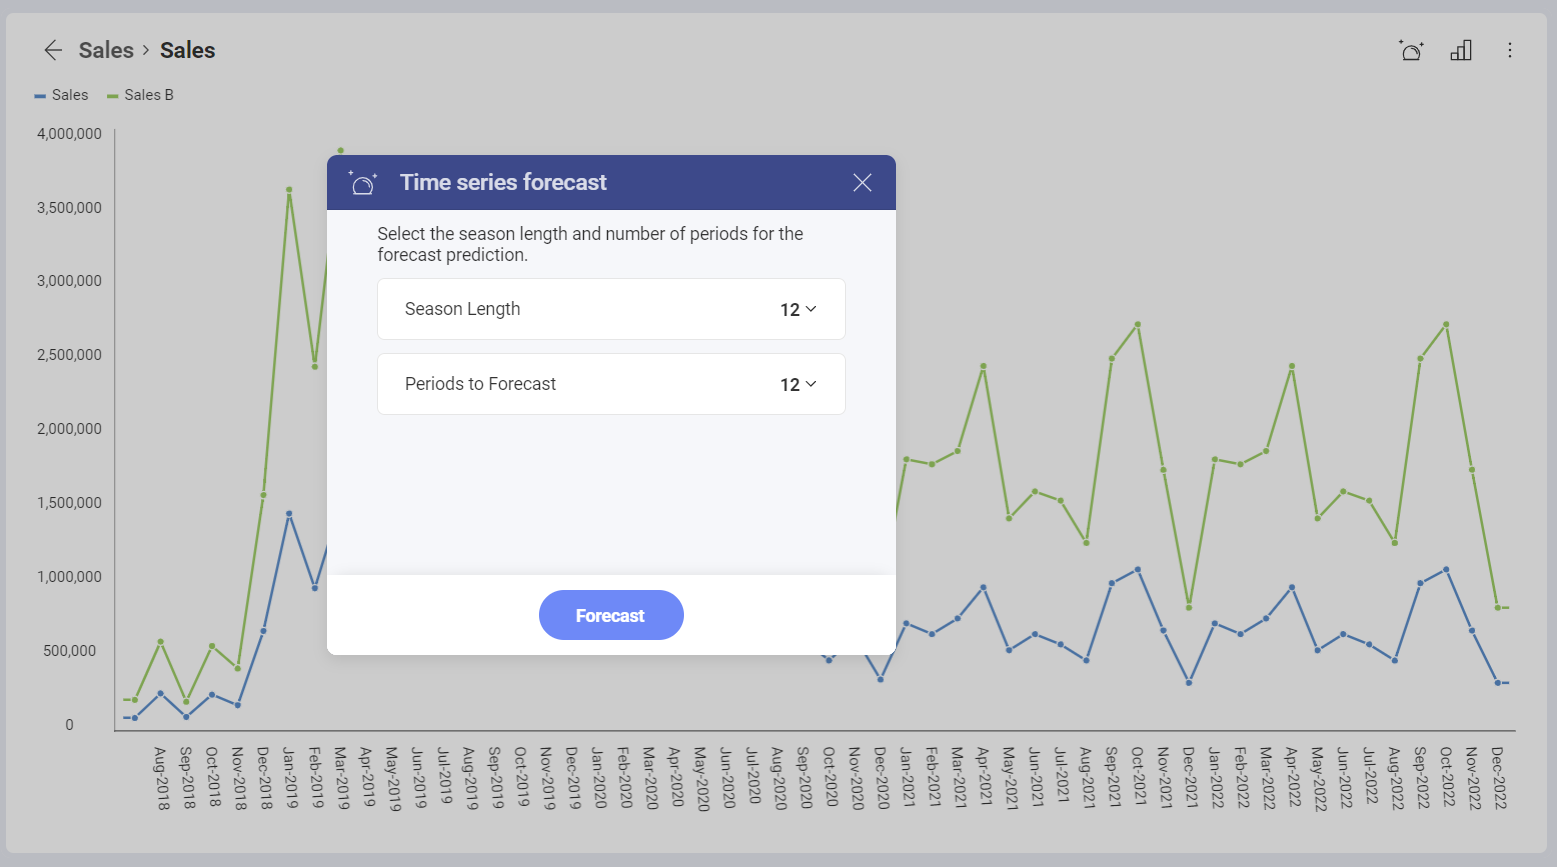
Here you need to configure Season length and Periods to Forecast.
Season Length - select the number of days, months or years in a season for your visualization. The time unit for the season length is determined based on whether your Date field is measured in days, month or years.
In time series data, a season is a specific regular interval at which variations occur. The Exponential smoothing algorithm in Analytics computes an evolving trend and uses a seasonal adjustment to equate it.
For example, the sales of ski accessories varies within a year - they may reach their peak in November and December and decrease significantly in April. This tendency will repeat the next year. That means the season length for this example is 12 months.
Periods to Forecast - select the number of days, months or years, for which you want your data predicted. The time unit for the periods is determined based on whether your Date field is measured in days, month or years.
[!NOTE] Minimum data available for the Time series function. Your visualization must contain a minimum of two seasons of data, otherwise you won't be able to use the Time series function. This means that if your season length is 12 months, you should have data for at least 24 months, if it is 6 months - data for at least 12, etc.
The forecast is visualized by a line and a shaded area around it. The line displays the prediction and the shaded area shows the range in which the future dataset is expected to fall in.
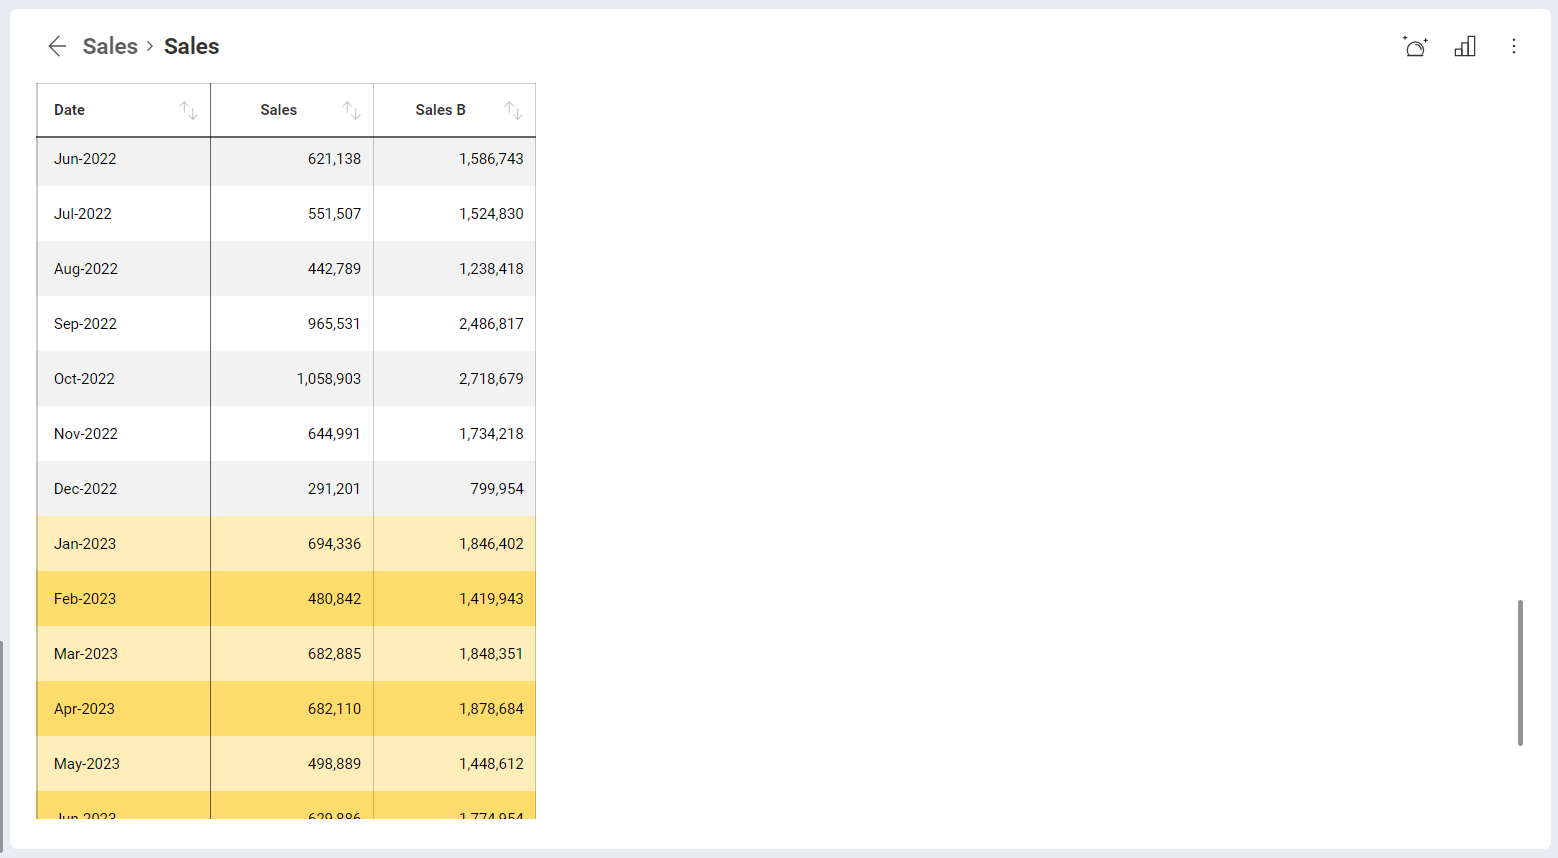
If you check the visualization's underlying data after the application of the Time series function, you will notice the forecasted values are highlighted in yellow (see below).
[!NOTE] The Time series function is available only for charts over time. If your visualization does not contain a Date field, you will receive an error when you try using the Time series function.
Linear regression
The Linear regression is a statistical model, attempting to show the relationship between two variables with a linear equation. The regression analysis results in graphing a line over your visualization, which aims to evaluate an on-going tendency. The line is calculated to go close to most of the points in the dataset, fitting the overall shape of the data.
The Linear regression function also allows you to include a linear forecast of the data for a selected period of time. After selecting the Linear regression function from the Statistical functions menu, you will see the following dialog:
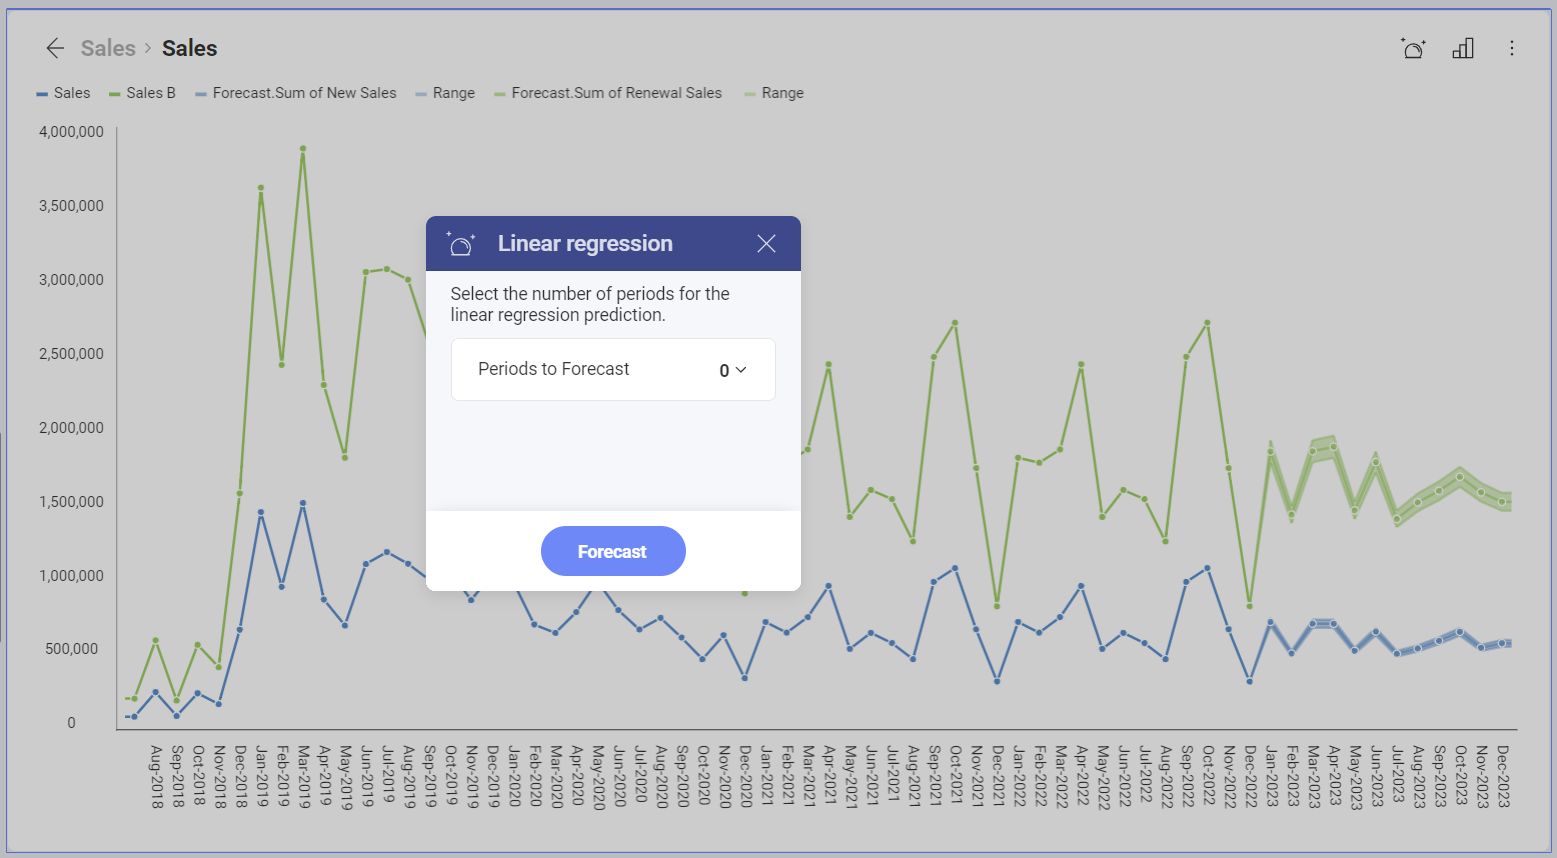
For Periods to forecast select the number of days, months or years, for which you want your data predicted. The time unit for the periods is determined based on whether your Date field is measured in days, month or years.
Below you can see the Linear regression function applied to a visualization, where the line is extended for 6 months to show a prediction based on the observed tendency:
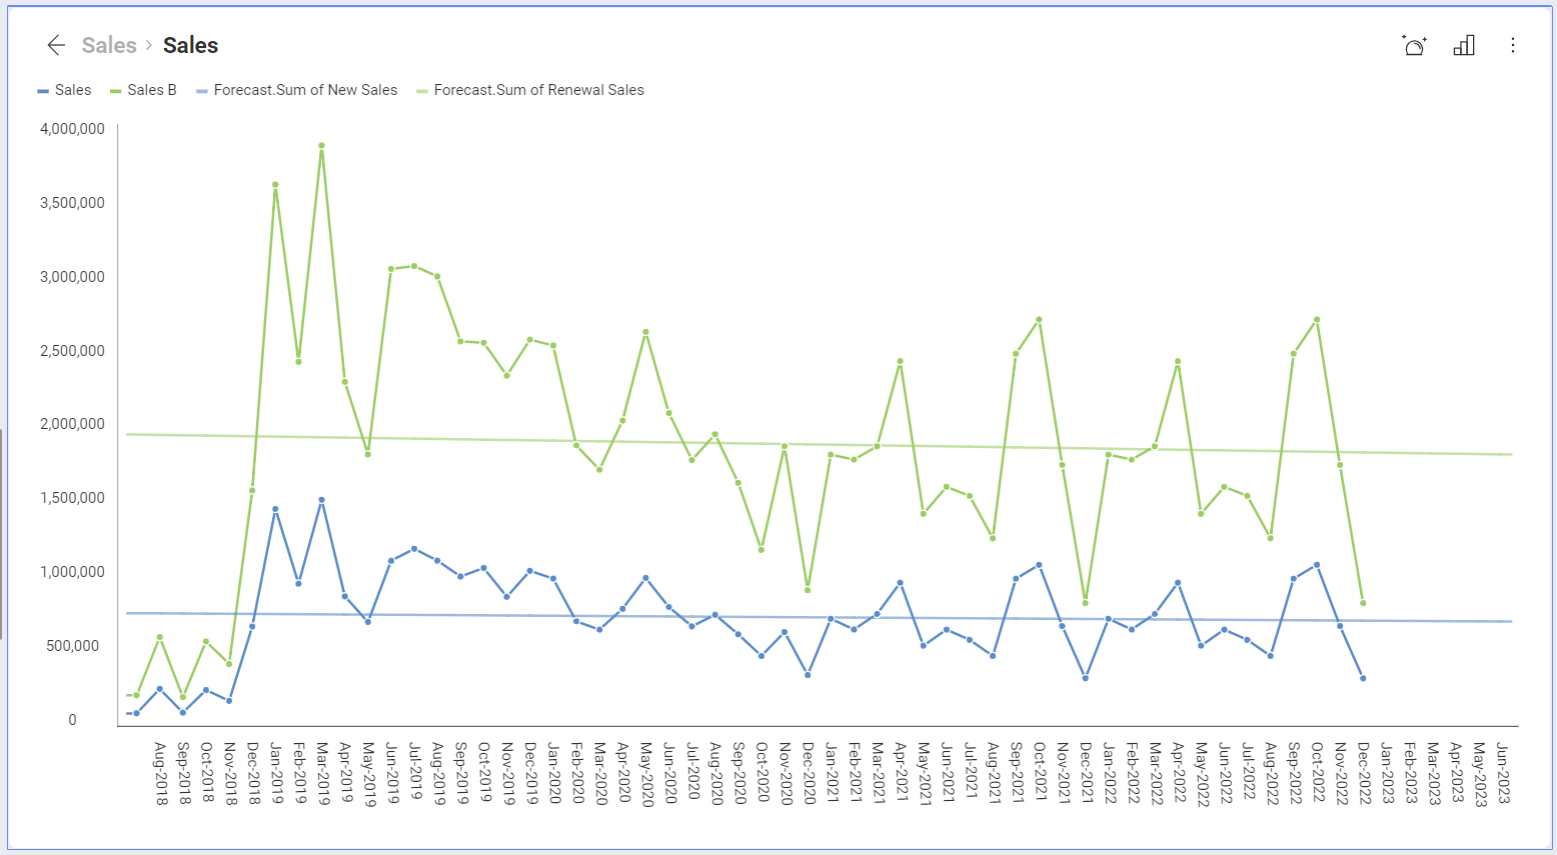
The line rendered across the visualization above shows the extent to which changes in the sales (variable placed on the y-axis), can be attributed to time (or other variable, placed on the x-axis). The linear relationship between sales and time data determines the line, which makes the tendency of sales slowly going down more visible.
If you check the visualization's underlying data after the application of the Linear regression, you will notice the forecasted values are highlighted in yellow (as shown in the last screenshot of the Time series forecast).
Detect outliers
Outliers are extreme values that deviate from other observations on data. The Detect outliers function shows points that deviate considerably from the average values of the rest of the points in the data series.
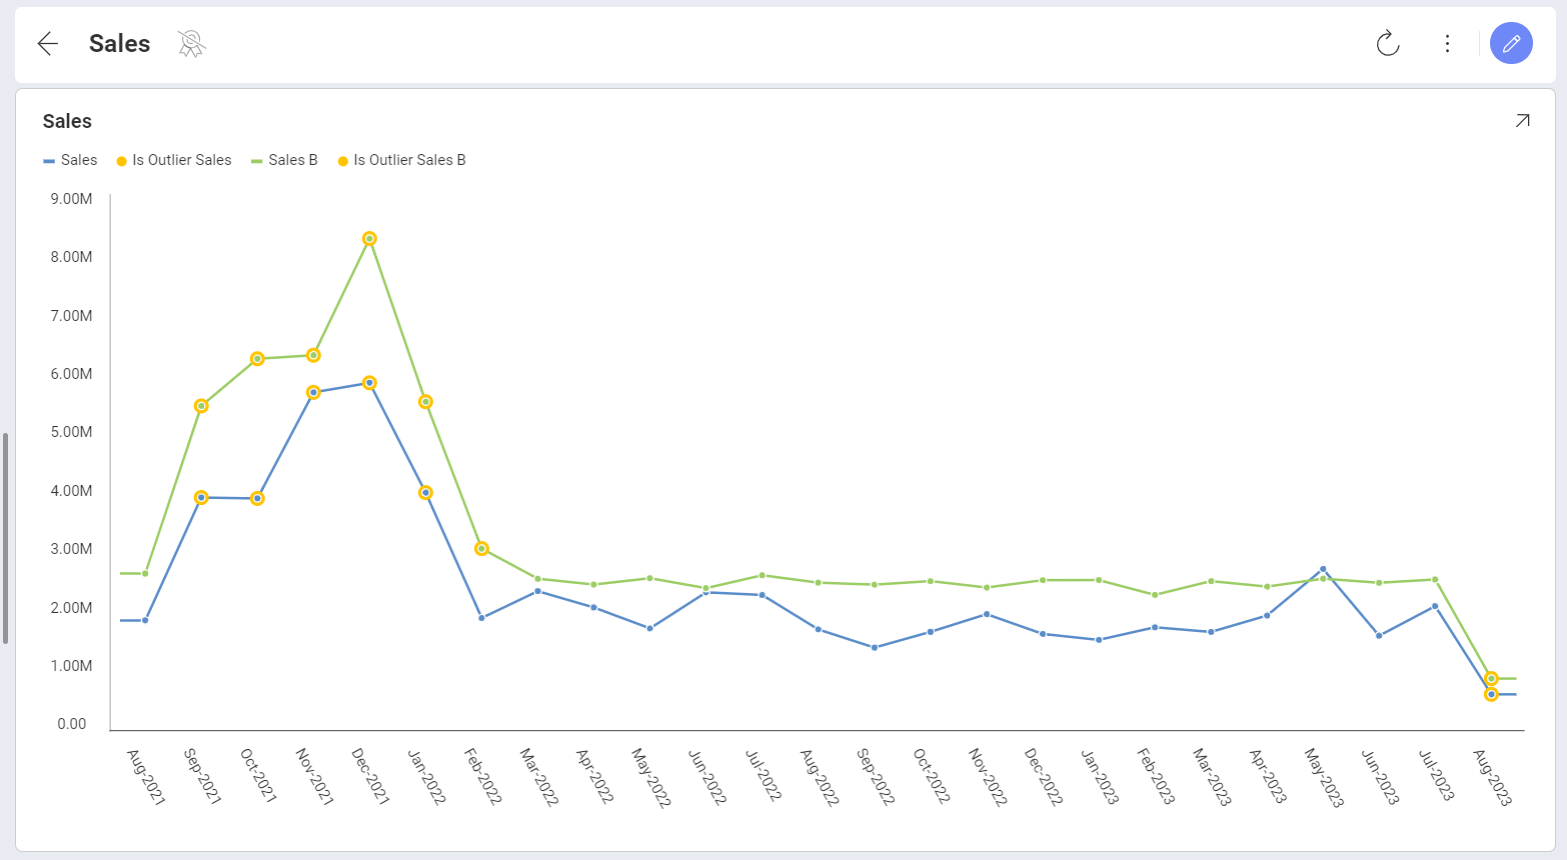
In the example above, the detected data points lay far from the rest of the distribution and show a sudden rise in sales in a particular moment, which diverges significantly from the overall pattern of sales.
If you check the visualization's underlying data after the application of the Detect outliers function, you will notice the data detected as outlier is highlighted in yellow.