Working With Spreadsheets in Analytics
Below are a couple of helpful tips and tricks for working with spreadsheets within Analytics.
Analytics expects your data to be organized in columns and will name fields after the spreadsheet's first row. If your data is organized in rows instead, you can transpose the fields in Analytics. |
When working with CSV files, avoid formatting the spreadsheet. Instead, apply any necessary formatting (1000 comma separators, currency signs, etc.) through Analytics. |
For 2 or more series charts, the order in which you drop fields in "Columns", "Rows" and "Values" will determine how the chart is plotted, regardless of the column order in your Excel file. |
If columns have different types of data combined (strings, numbers, etc.), Analytics will treat them as a column with strings only. This will affect, among other things, formatting. |
Password-protected files and hidden ranges are not supported in Analytics. |


Data Ranges
Excel files allow you to select a custom range of data within your spreadsheet, while CSV do not. If you need to select specific data, make sure you always work with an Excel spreadsheet. |
If you have a spreadsheet with a named range, you can choose that specific Named Range as a data source. |
If your Excel data is organized in non-adjacent columns, Analytics will pick up the column with most data. |

Dates, Numbers and Percentages
By default, numbers will have 2 fraction digits. To change this, access the Formatting menu for the field. |
The 1000 separator is disabled by default, even for large numbers. To turn it on, access the Formatting menu. |
If you need to show percentages or currencies, you will need to select that option from the Formatting menu. |
If you want a date as a column header, make sure you include a ' so Excel will respect your format. The default date format for headers is the full-length format (YYYY-MM-DD 00:00:00 +0000). |
Percentages in Excel sheets will be shown in a 0 to 1 scale unless the format is changed to "Percentage". For example, 39% will be displayed as 0.39. |


Transposing Columns to Rows
When working with Microsoft Excel and Google Sheets, you can use the transpose functionality to switch columns from rows.
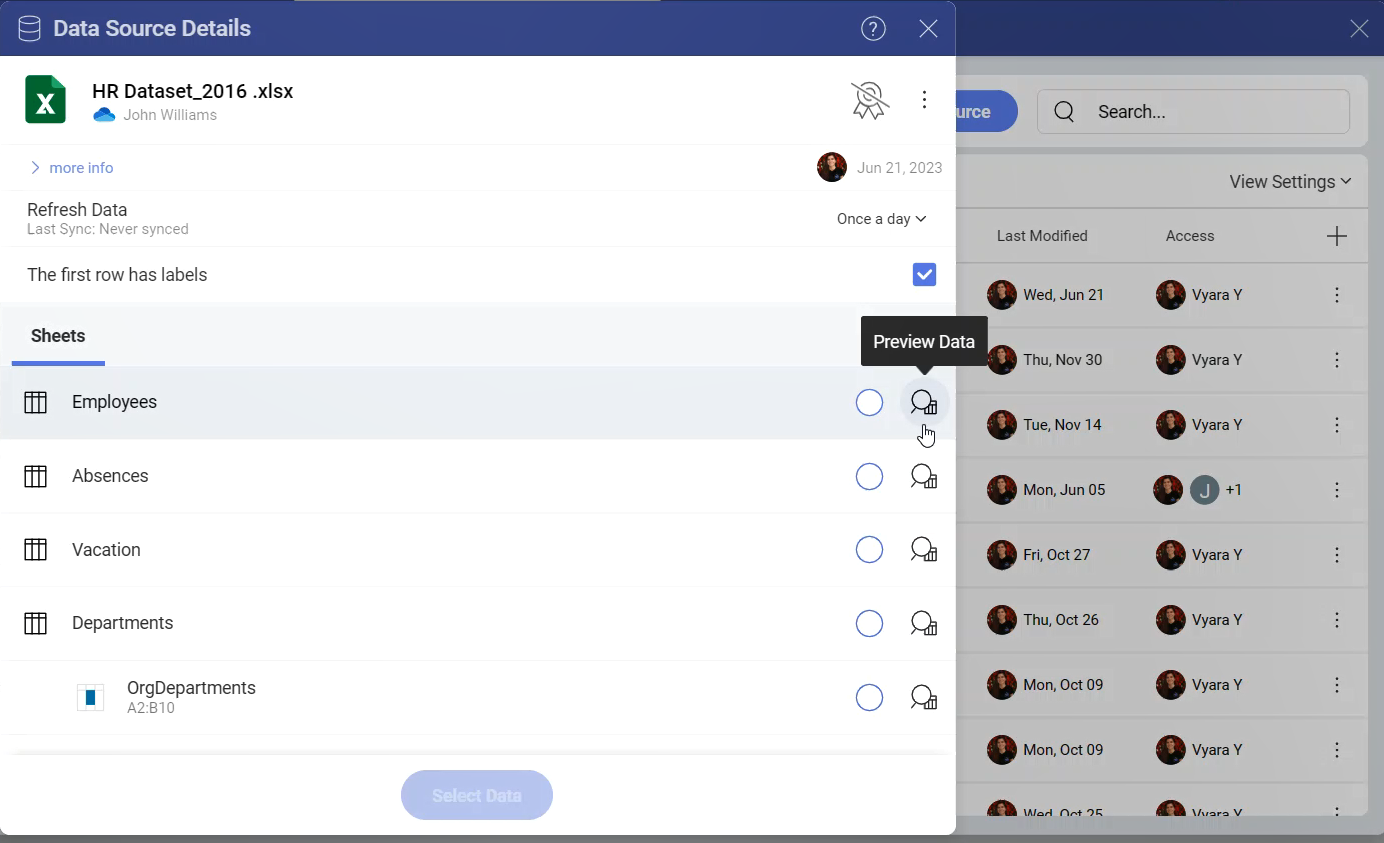
To make this change, you need to first click/tap on the Preview Data button for the chosen sheet.
[!NOTE] Only the first 200 rows in the spreadsheet will be transposed.
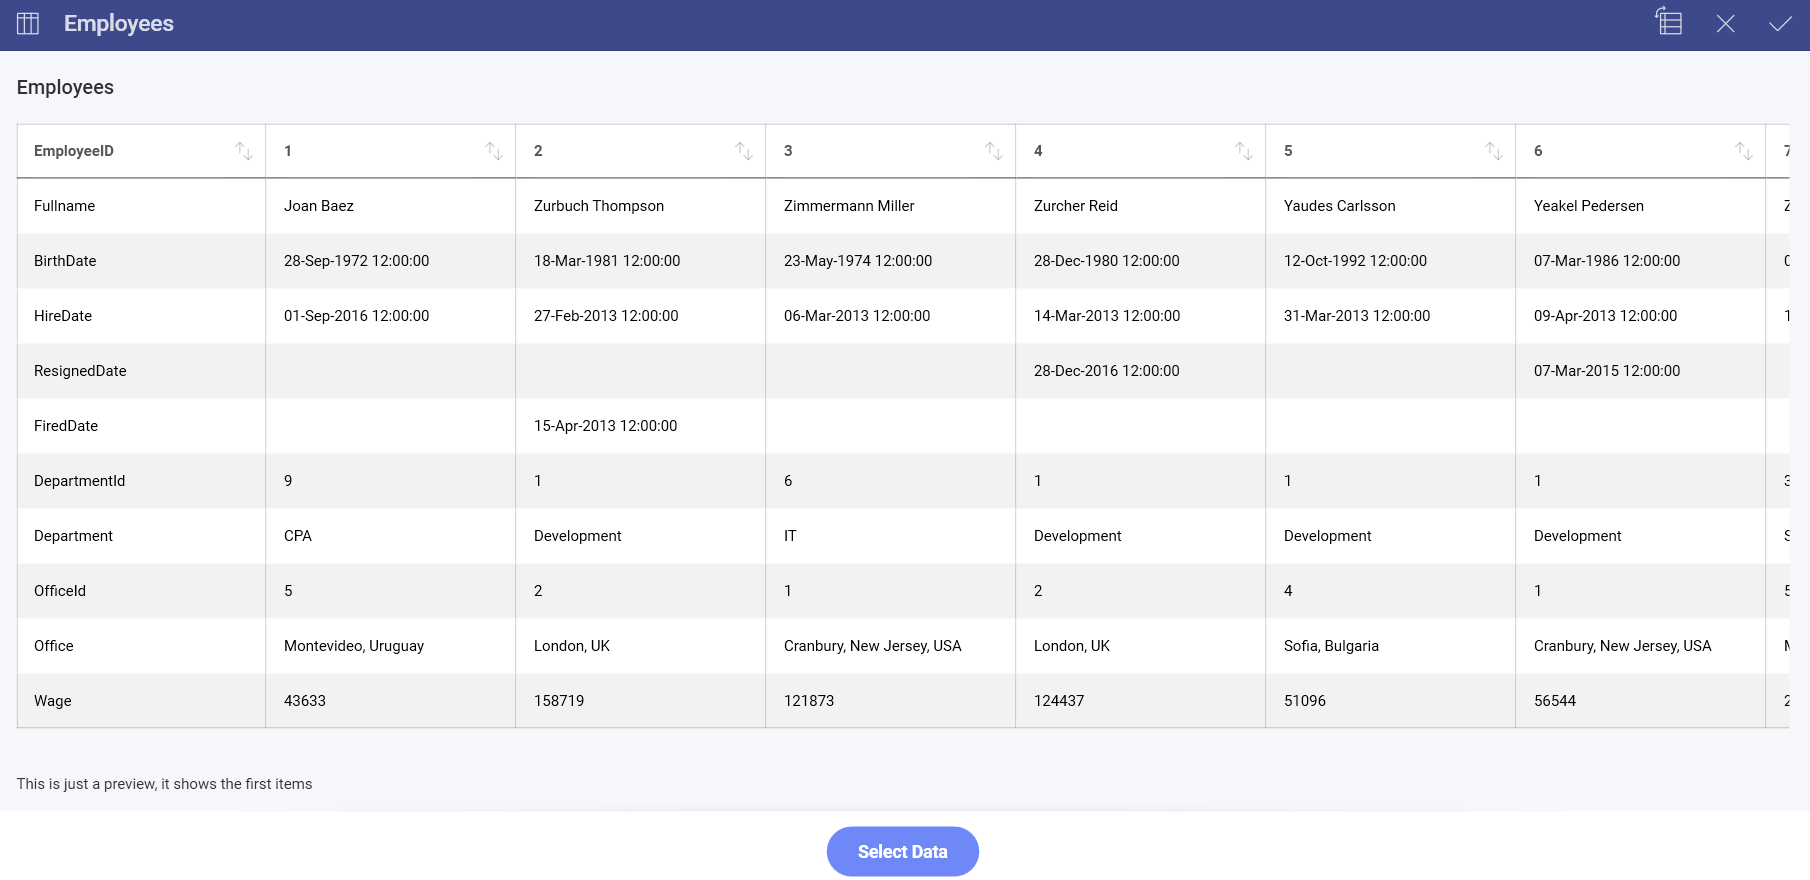
Then you will see a transpose icon in the top right-hand corner next to the cross button. Once you click/tap on it, Analytics will switch columns to rows and vice-versa.
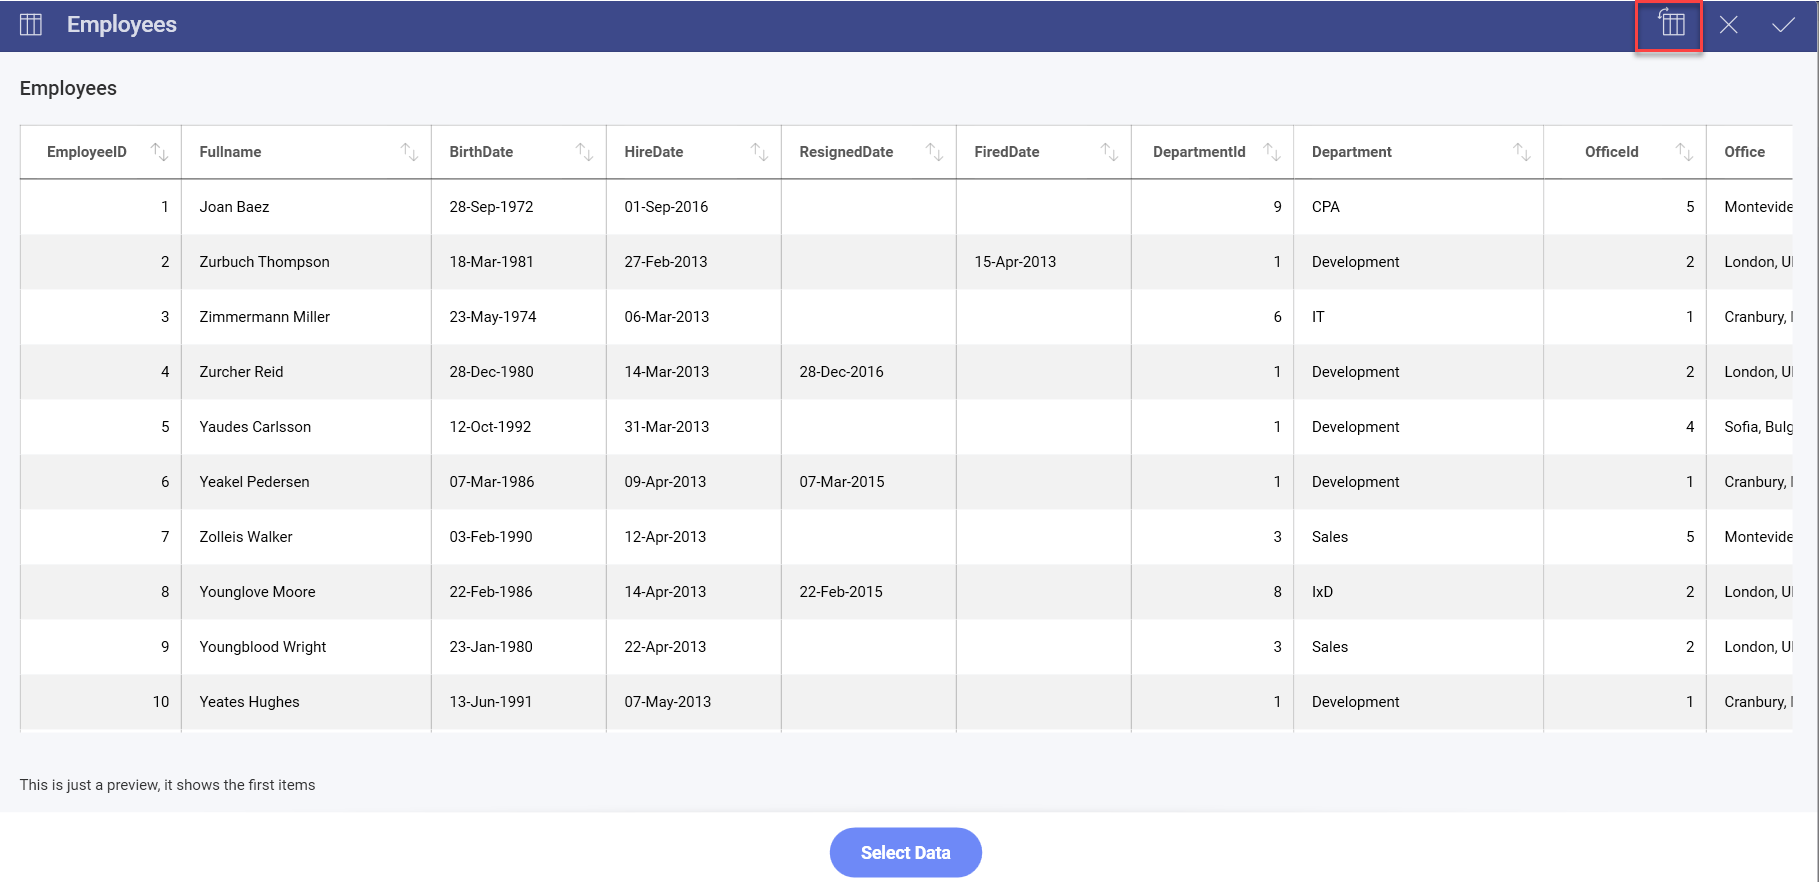
In the example above, the information in the spreadsheet will be organized in columns expressing the EmployeeID for each employee in the company.
Once you are ready, select the tick icon. This will take you back to the Data Source details dialog, where you will now see the name of the sheet with a new icon to its left indicating that the sheet has been modified.
See Also
A common use case is building dashboards with spreadsheets located in a cloud file sharing service. To learn how to successfully share those dashboards with other users, please read Sharing Dashboards with Cloud Files as a Data Source.