My Analytics
With the My Analytics section of Slingshot, you can bring the power of BI (business intelligence) into your daily workflow while helping your team make faster data-driven decisions.
What's in My Analytics
In order to make data-driven decisions, Slingshot is on your side with the following features:
Dashboards - Create or share dashboards so your team can utilize data and improve productivity. Bring multiple data sources into one dashboard to ensure that you have all the information in one place.
Data Sources - Connect directly to wherever your data comes from, including content managers, cloud services, CRMs, databases, spreadsheets, and more.
Data Catalog - Find the most trustful information about your company in the list of data catalogs. The data is categorized and certified.
[!Note] Data Catalogs are available only to Enterprise users.
Data Sources make up visualizations and visualizations make up dashboards. In other words, your data comes from a data source, a visualization connects to that data source and displays the information. In order to increase productivity, dashboards include a collection of visualizations that have different pieces of related information.
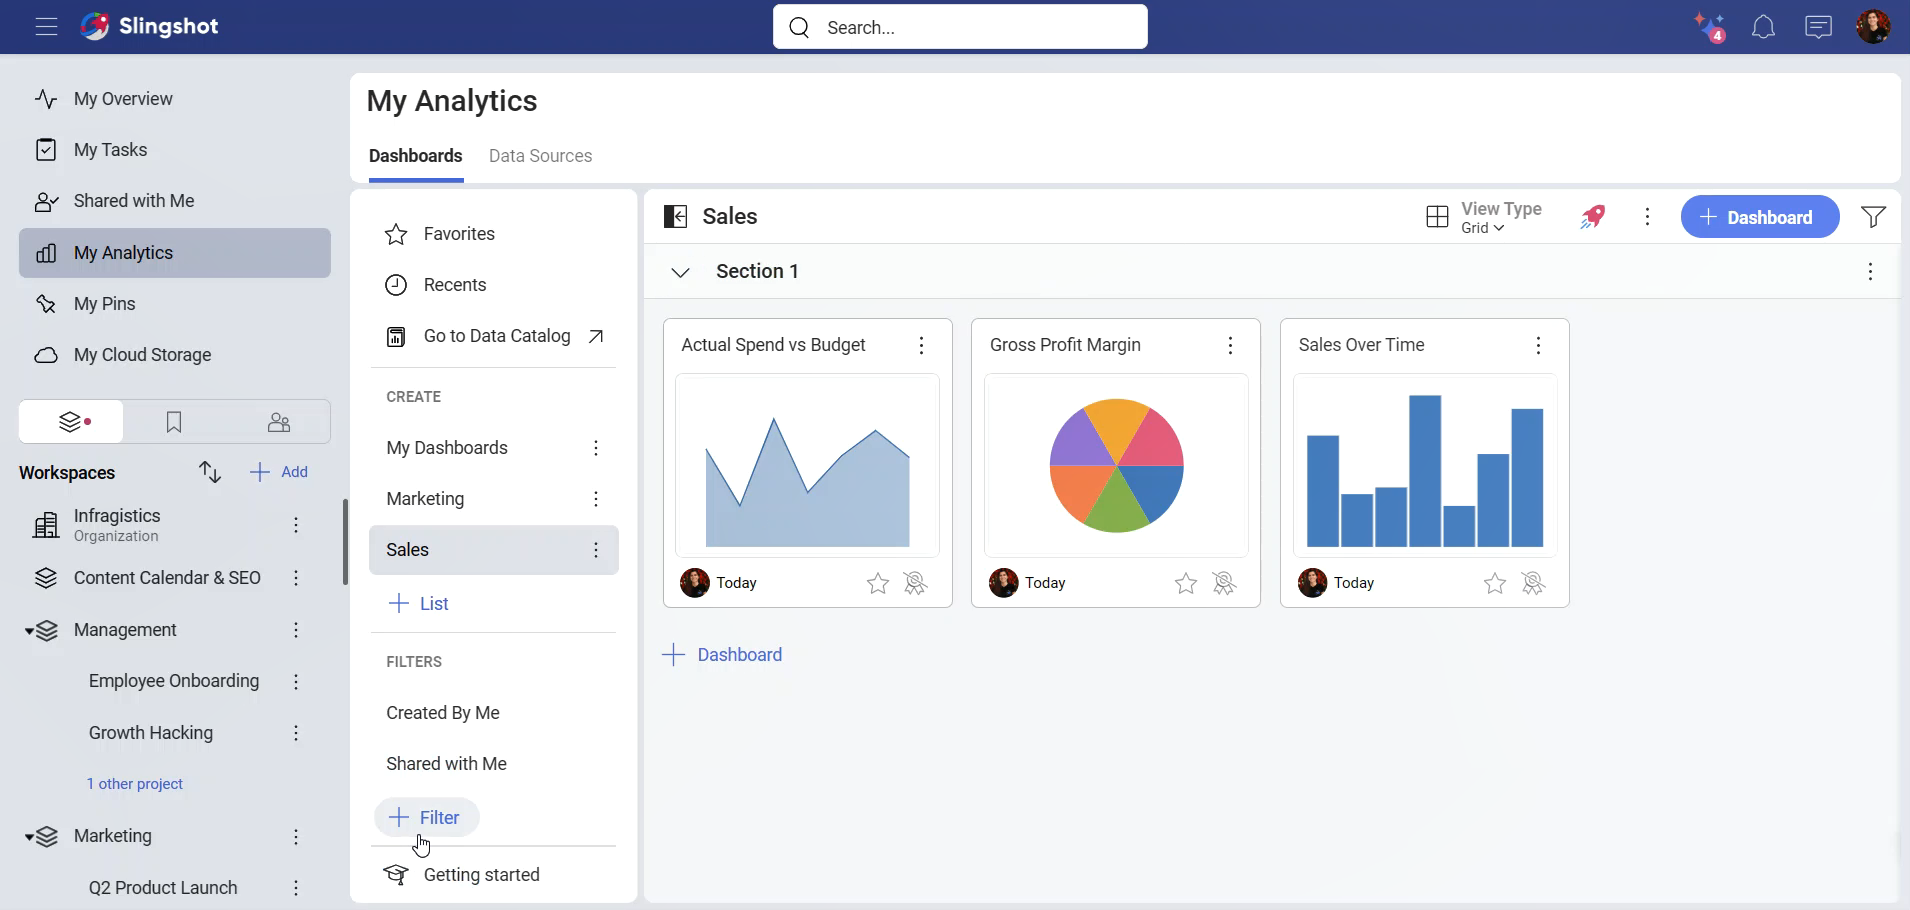
Dashboards
With an intuitive drag and drop interface, Slingshot makes it simple to create dashboards within minutes. Choose from more than 40 different visualizations to present your data and tell your story the best way.
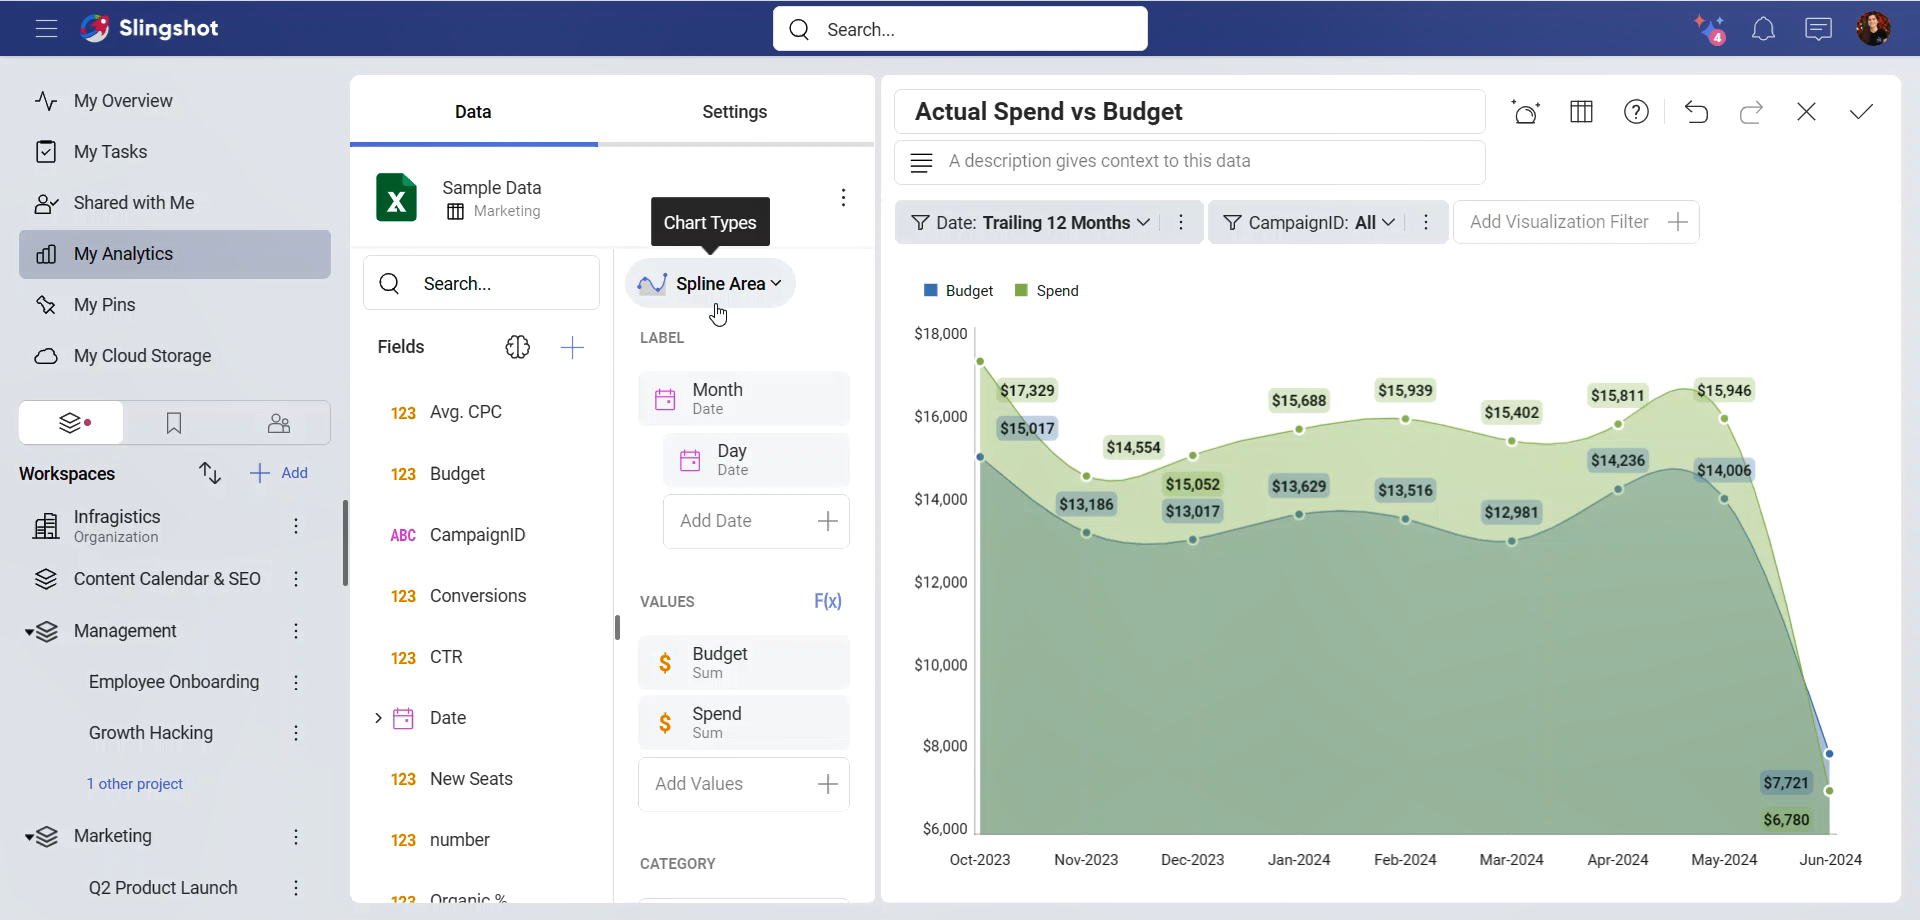
Customize
You can sort, filter and aggregate your data as you wish. Each chart type provides you with different settings to design your visualizations the way you want them to appear.
Read more about the different chart types here!
Interact
Once your dashboard is created, interact with your visualizations with the drill-up/down support.
Read more about how you can interact with dashboards here!
Share
Share your dashboards with others and collaborate over them. Different levels of permission types allow you to choose how to share the dashboards and what the access to them can be.
Read more about dashboards here!
Data Sources
Connect to the most popular data sources without setting anything up on the server. Get real-time insights by connecting directly to SharePoint Online, Google Drive, OneDrive, Microsoft Analysis Services, Microsoft SQL Server, CRM, and many more.
Click here for a full list of connectors!
Connect
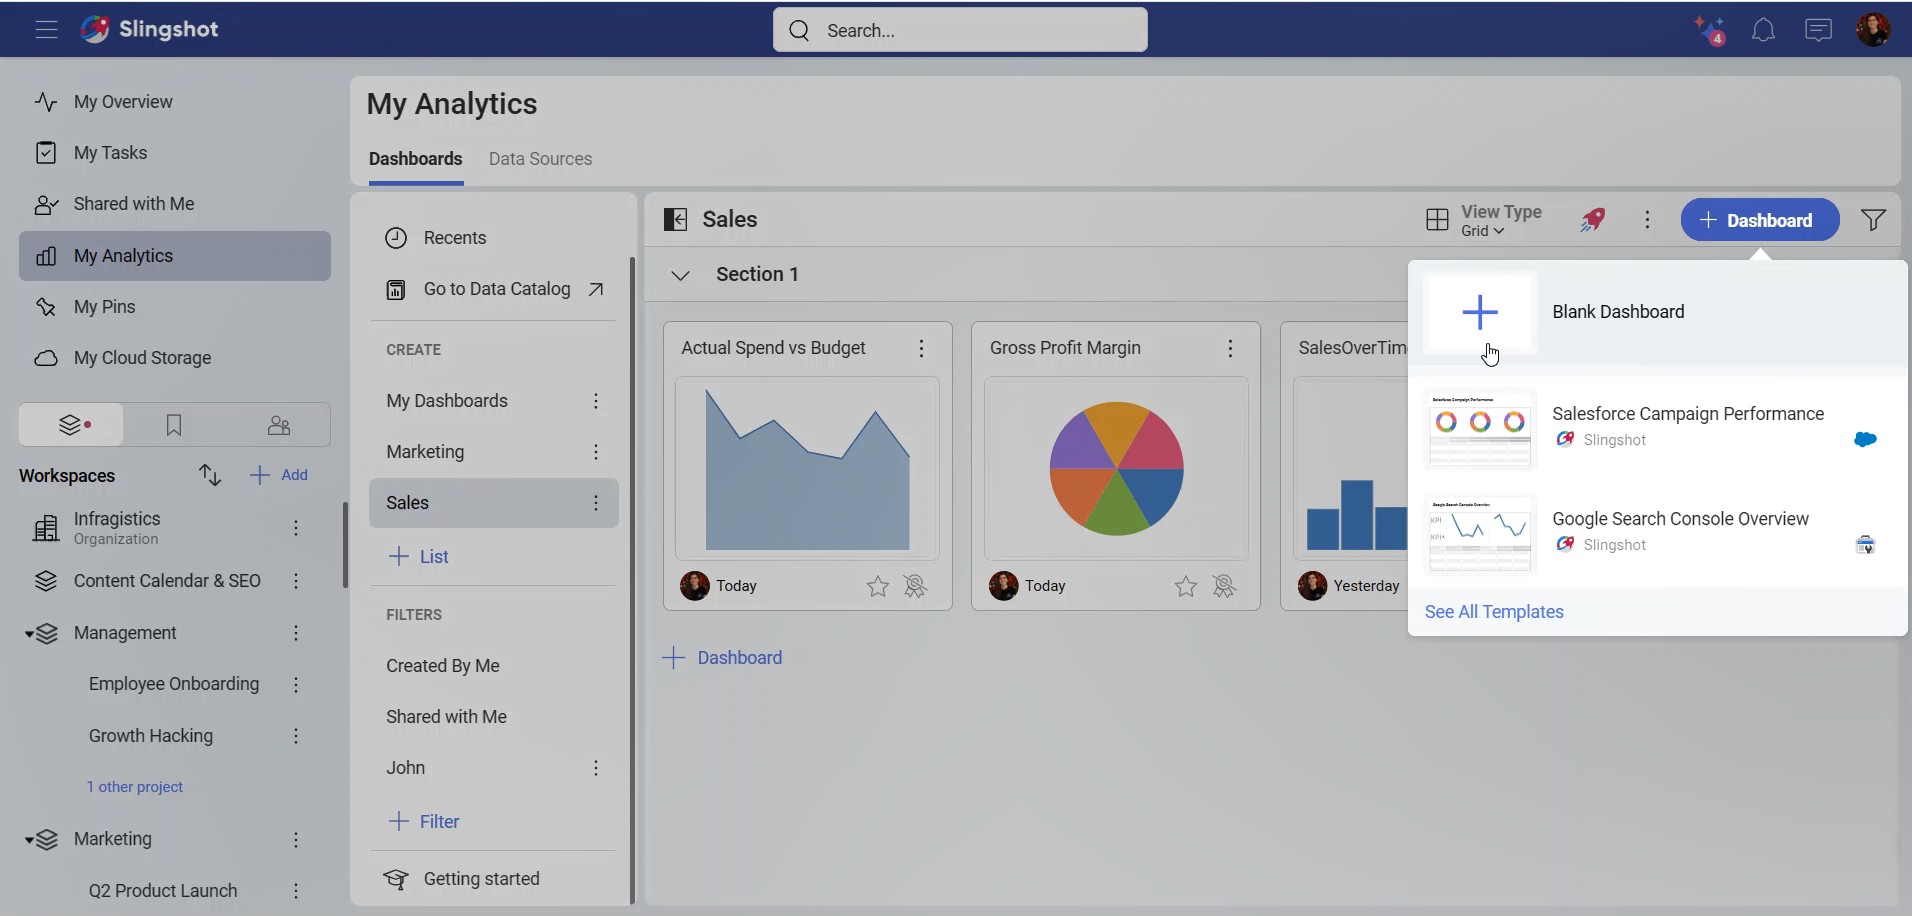
To connect right to your data source and build your visualizations, you can follow these steps:
Click/tap on the + Dashboard button in a dashboard list, or the Create Dashboard blue button in the Getting Started section.
Click/tap on + Data Source in the top right corner to select the data source you want to connect.
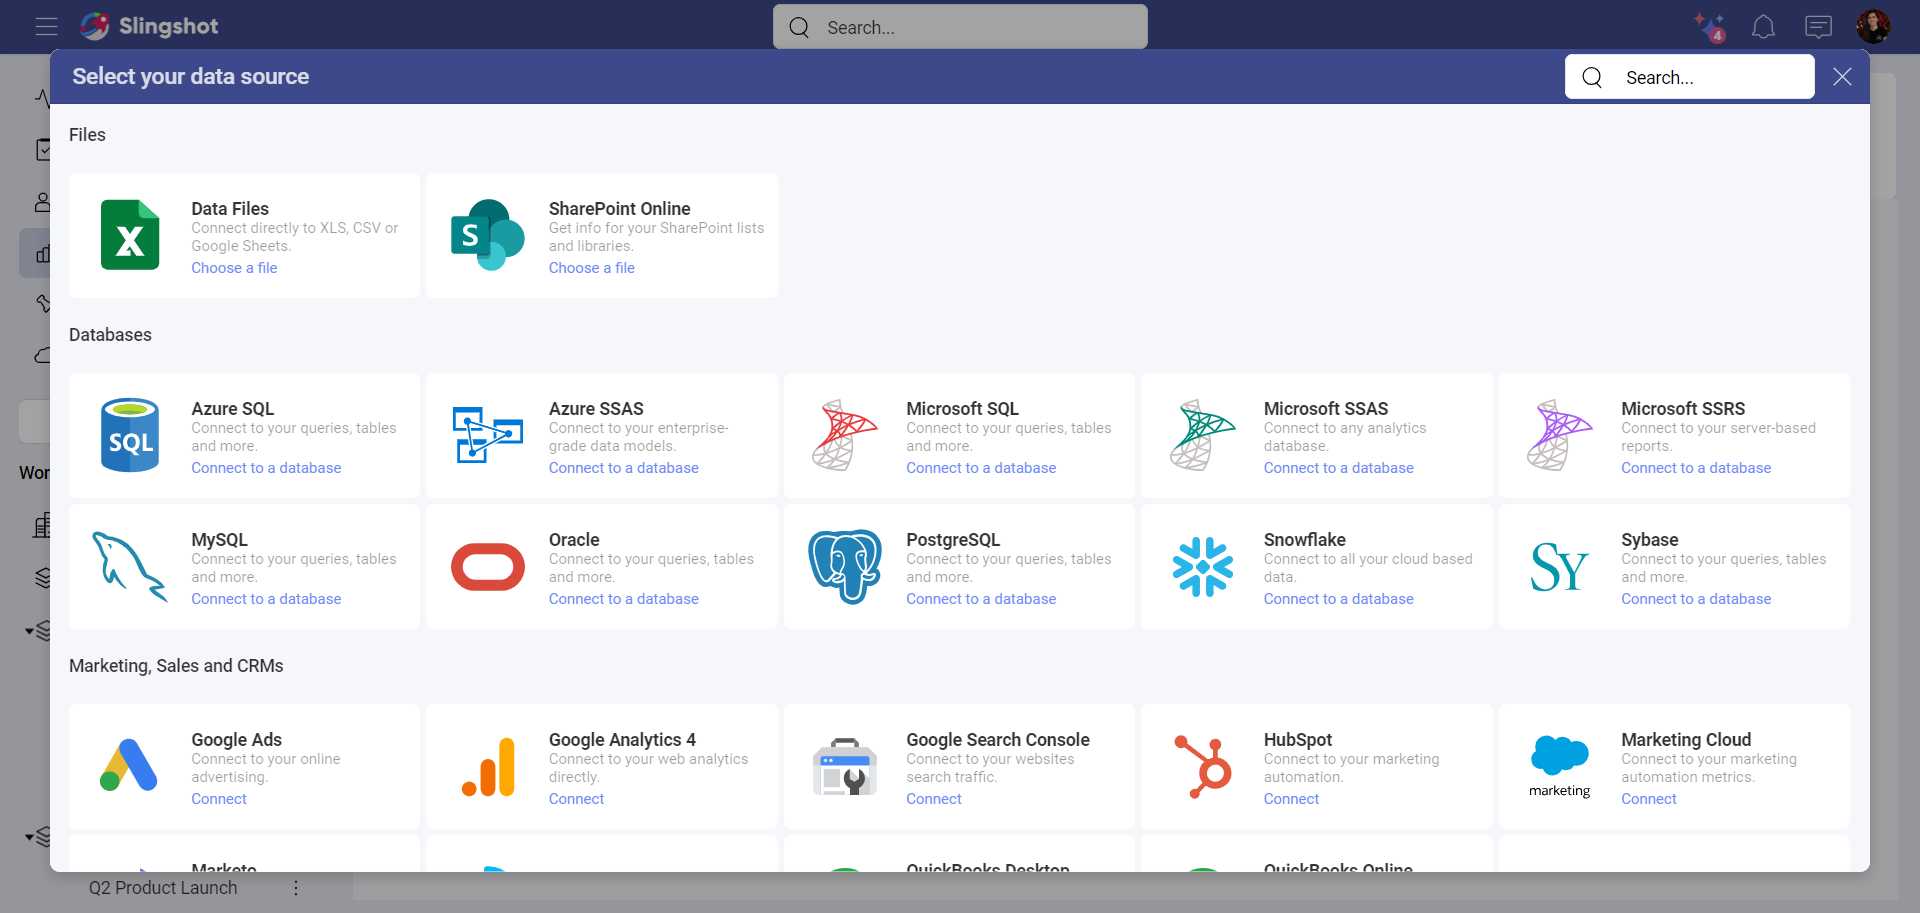
Configure the connection. This might include selecting the file’s location (spreadsheet or JSON file) or enter credentials (data storages, web resources, social media connectors, databases).
Data Catalog
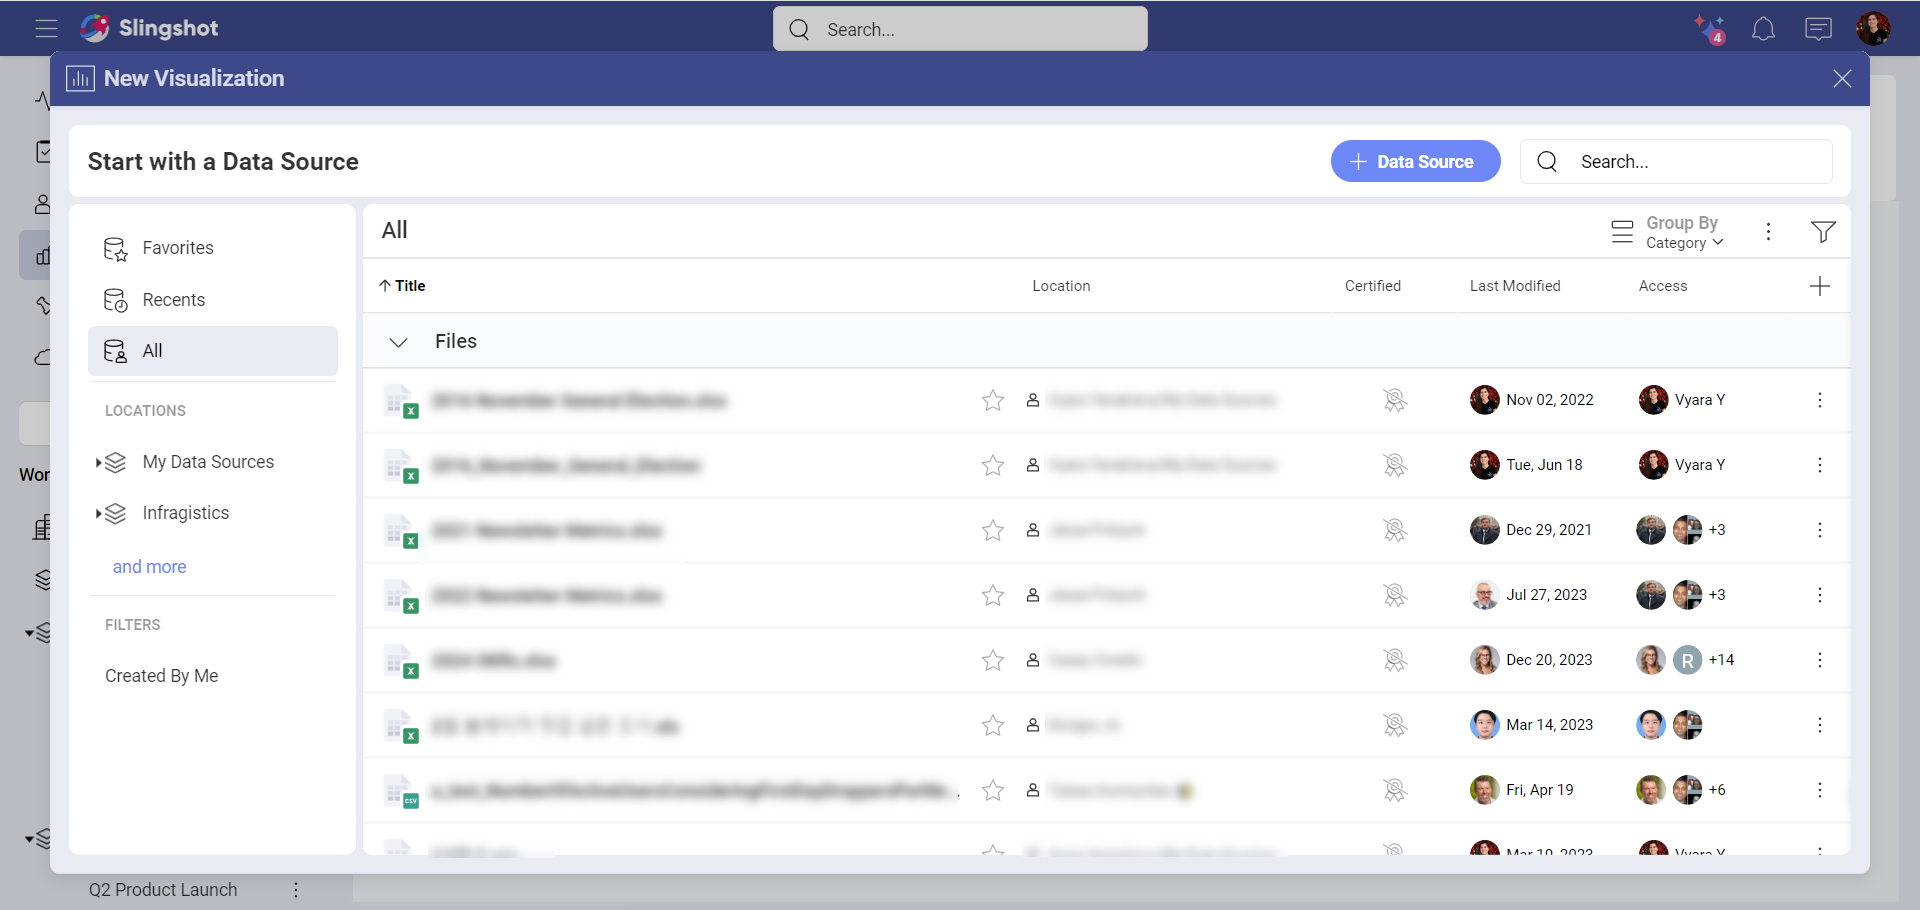
Your organization’s data catalog makes it easier for users to quickly find the insights they are searching for. With this feature, Enterprise users can access an extensive catalog of dashboards and data sources.
Certifications are an important part of the data catalog, as they assist you to find the most trusted data within the organization. This is an excellent way to know which dashboards or data sources are reliable and contain verified information. When a dashboard or data source is certified, you will see a gold, silver or bronze colored badge next to it.
Read more about data catalog here!
Lists
You can manage multiple lists of dashboards and data sources, which are designed to organize, manage and share those resources. The Dashboards and Data Sources tabs have lists that can be further organized in sections. Sections are useful to add divisions and to better layout your content.
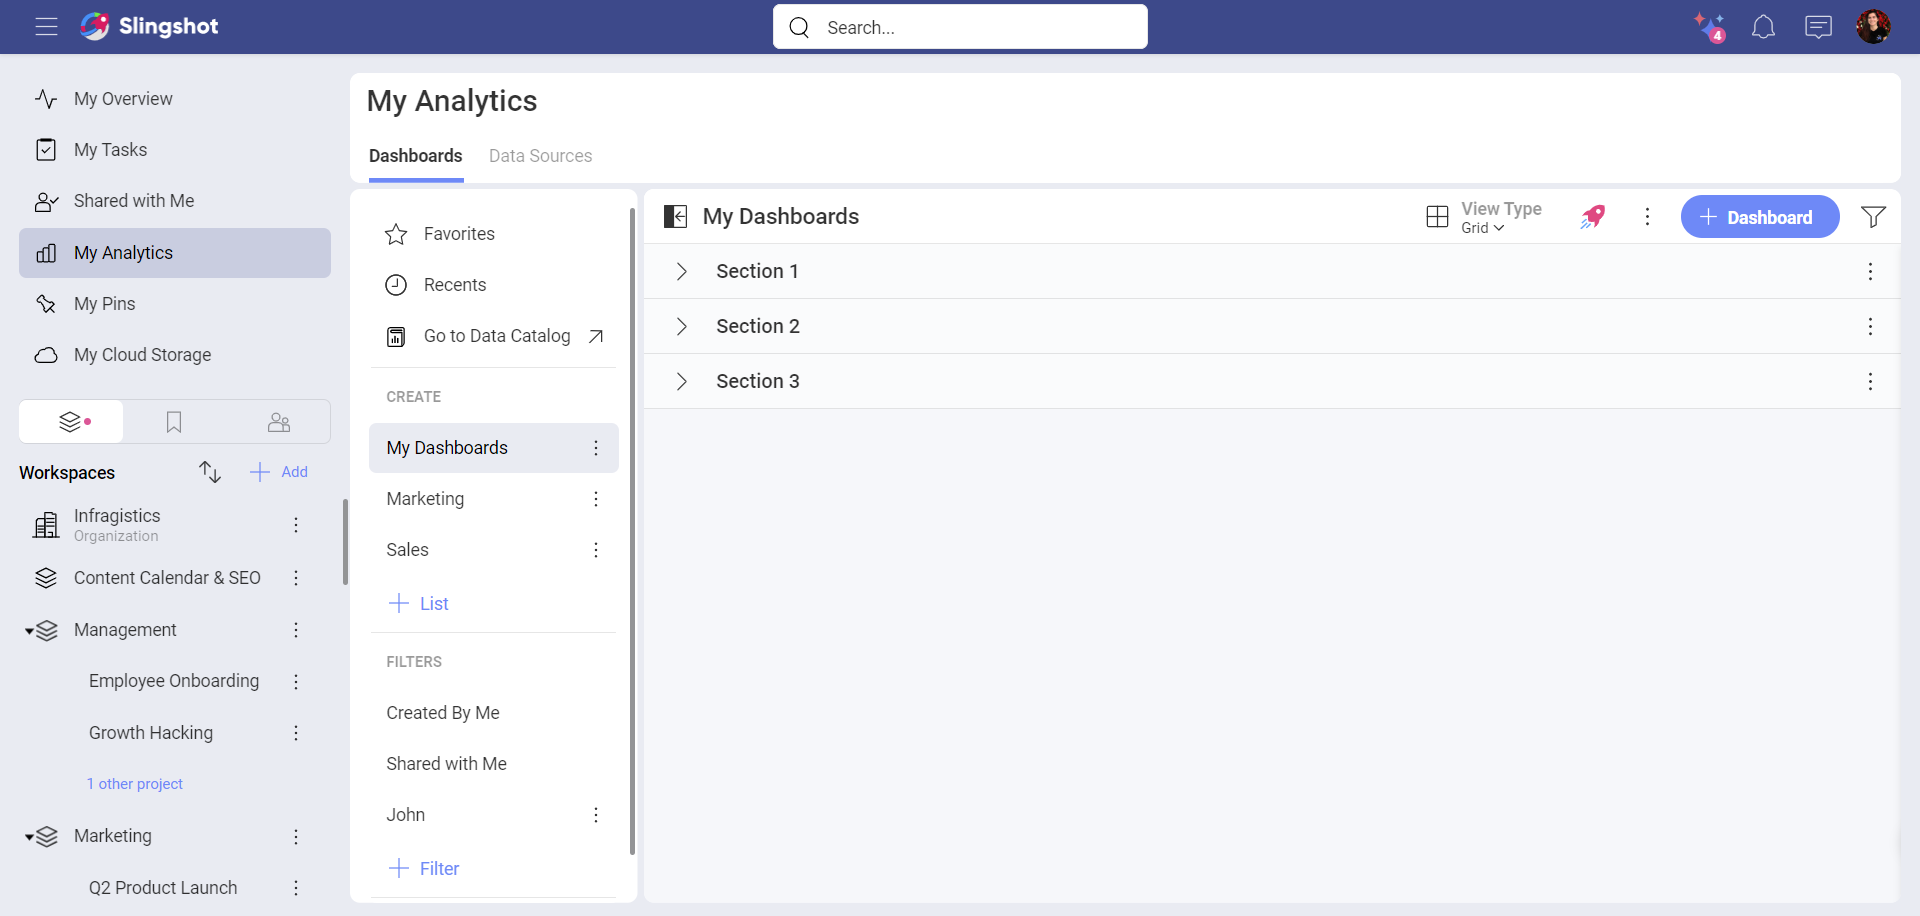
Out-of-the-box Lists
By default, you start with the following lists - My Dashboards and My Data Sources, but you can create more lists and easily reorganize and move them just by dragging them.
Filters
Using filters allows you to view a set of dashboards or data sources that meet certain criteria. There are also filters out-of-the-box that you can save for future re-use.
Out-of-the-box Filters
Slingshot includes several pre-defined filters which are very useful to quickly find specific dashboards or data sources.
These filters, which can’t be edited or deleted, are:
Created by Me - Each dashboard or data source created by you within Slingshot.
Shared with Me - Each dashboard or data source that has been shared with you by another Slingshot user.
Creating Filters
In order to create a new filter, you can:
Click/tap on + Filter in the FILTERS section.
Choose what to include in your filter, click/tap on Done and then Save in order to save it in the list of filters.
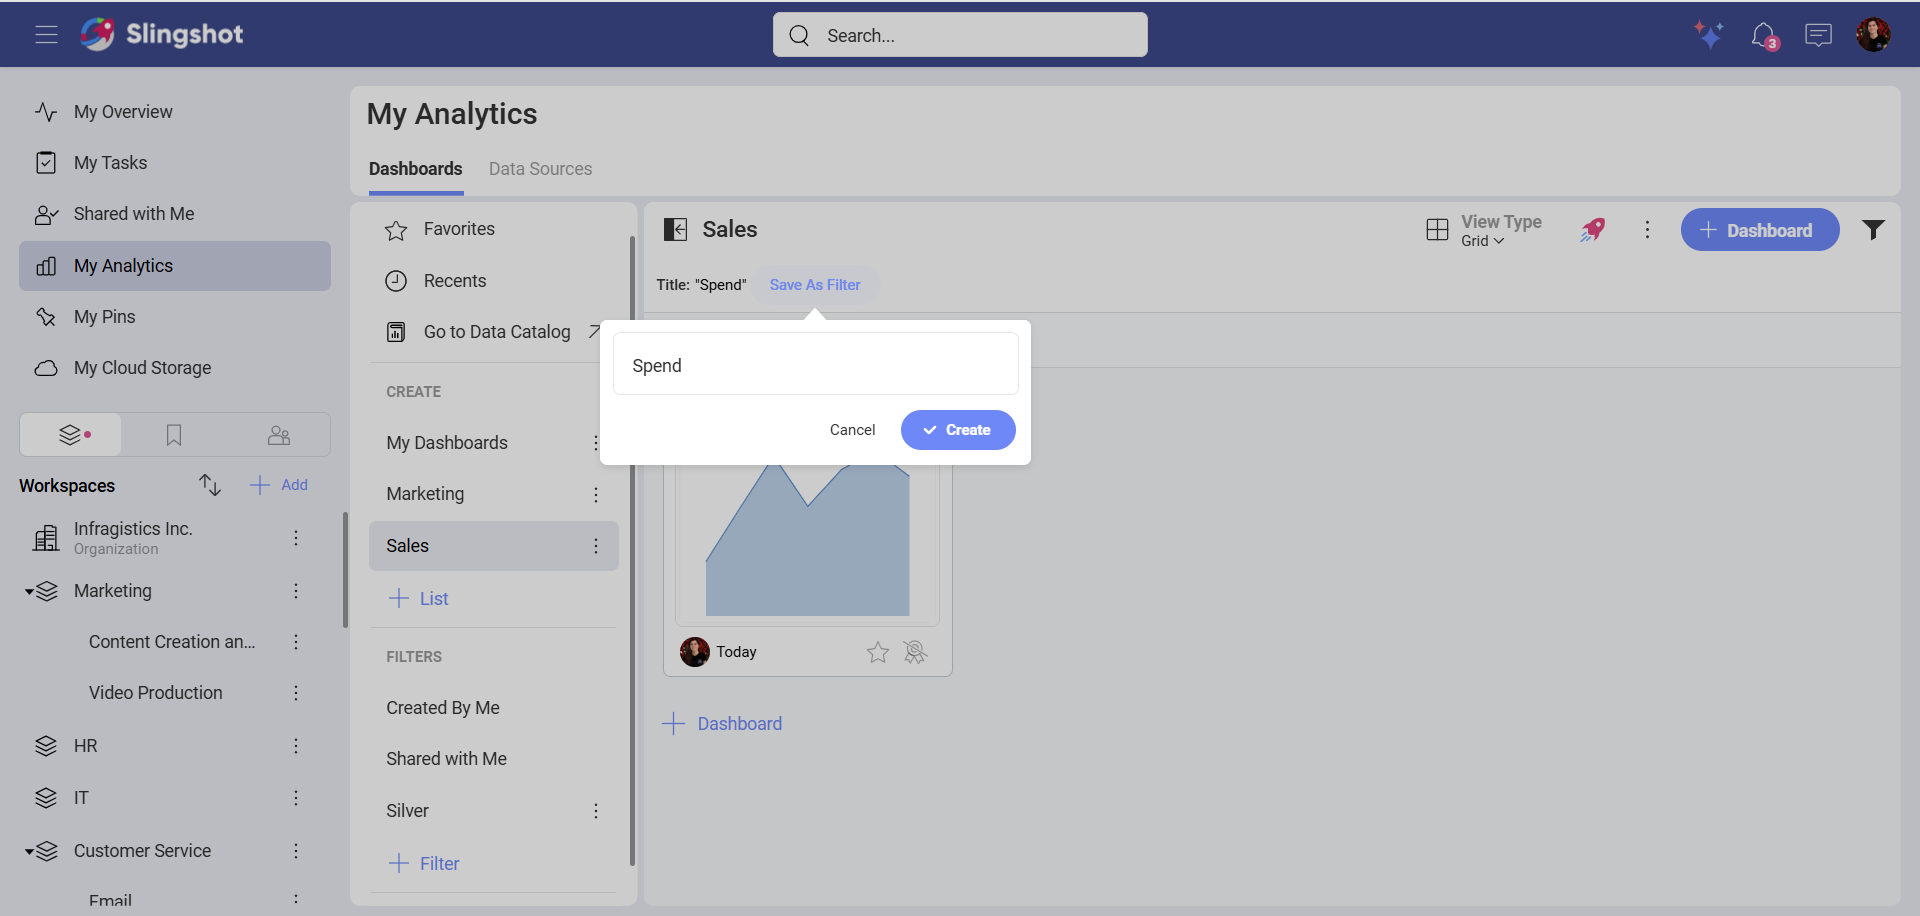
Alternatively, you can:
Click/tap on the Filter icon in the upper right corner.
Choose what to include in your filter, click/tap on Done and then Apply to save the changes.
Click/tap on Save as Filter to name the filter.
Click/tap on Create to save the filter.
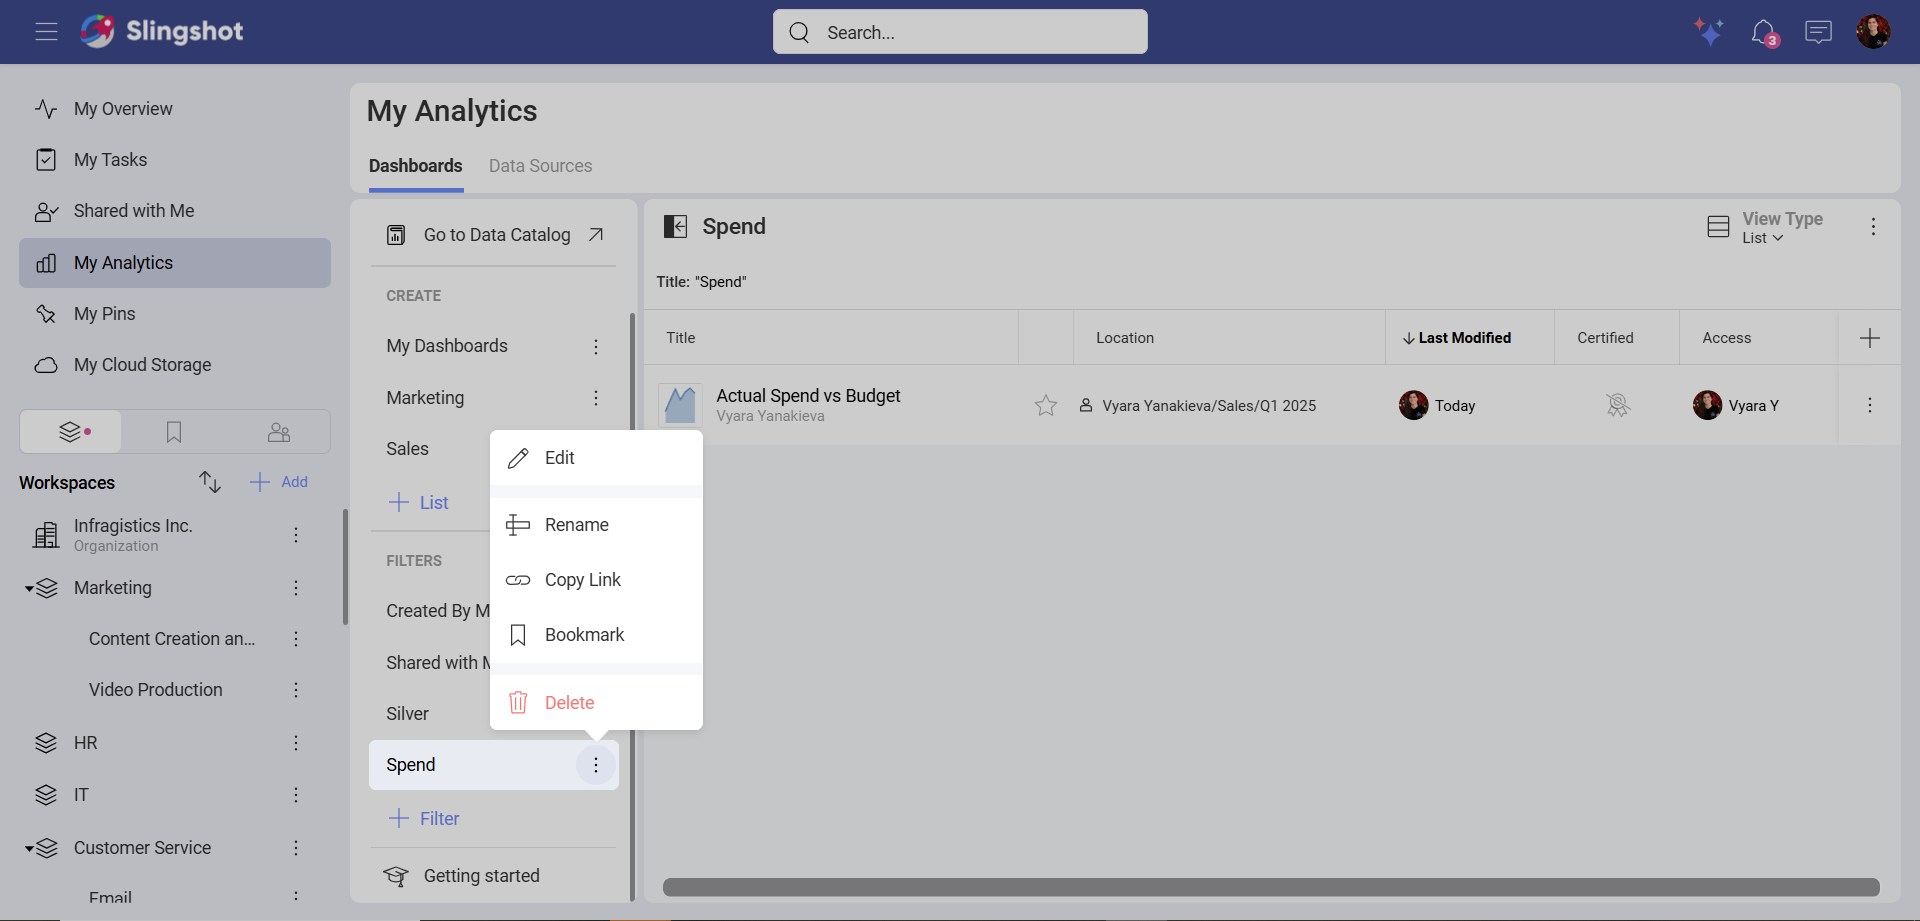
You can also edit a filter. To do that, you can:
Open the overflow menu of the filter.
Choose Edit.
You will be presented with the same filter settings as the ones shown above. Choose what to include or excluse from your filter.
Click/tap on Save to update the filter.