Data Sources Advanced Information
The Advanced Data Sources editor in Slingshot will improve how you and your teams work with large datasets. It allows you to modify the metadata of your data sources. Metadata is information about the data sources such as which datasets they contain, their data fields' types and descriptions, last modified date, etc.
Using the Advanced Editor will help you organize your data sources so that you will be able to:
Quickly find the data you need for your visualizations by hiding irrelevant datasets.
Make the data easy to understand by editing or adding descriptions for data fields.
Automate repetitive actions or avoid confusion by changing the default type of a data field.
Continue reading to learn who can edit the data sources' metadata and how to do it.
[!NOTE] You cannot edit some data sources due to limitations related to their type or certification.
Accessing the Advanced Editor
You can access the Data Sources Advanced Editor by editing an existing data source in a ![]() Data Sources list or even while adding a new one.
Data Sources list or even while adding a new one.
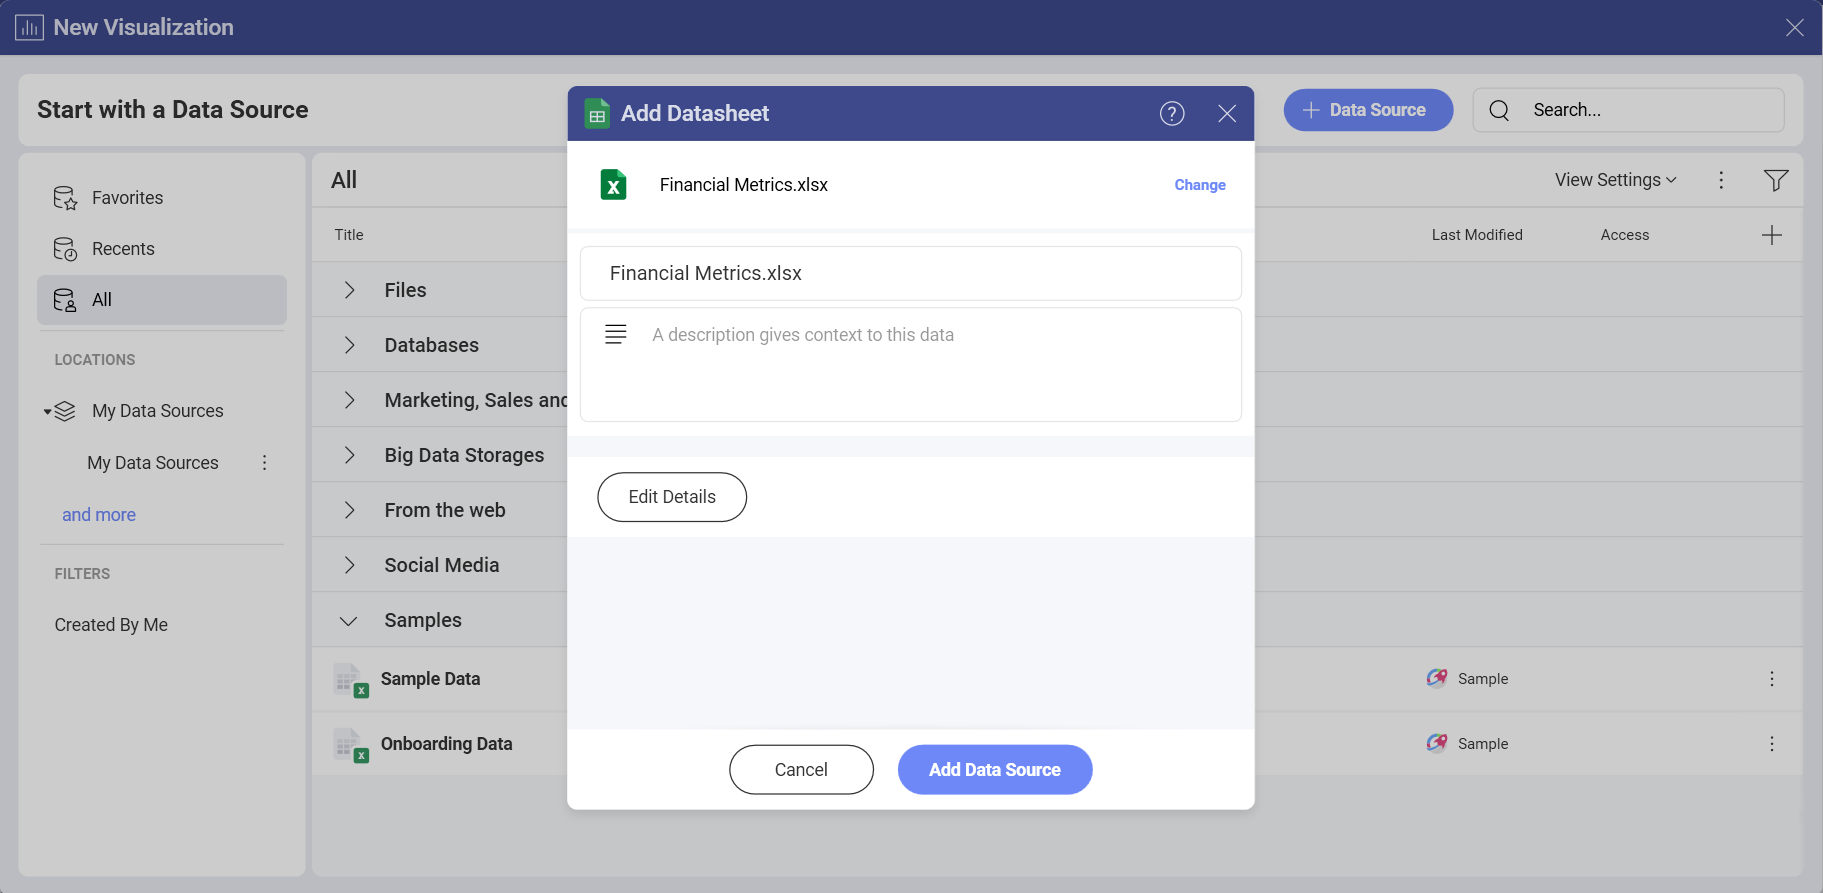
Right before completing the process of adding a new data source, you can access the Advanced Editor by selecting the Edit Details button (see below).
To open the Advanced Editor for data sources that are already added in the ![]() Data Sources list, follow the steps below.
Data Sources list, follow the steps below.
- Select the
 overflow menu next to the data source.
 - Choose
 Edit Details from the dropdown.
You may need to provide username and password for the selected dataset before you continue to the Advanced Editor.
Who Can Use the Advanced Editor?
Check the table below to find out who can use the Advanced Editor of the data sources in a workspace and in the Organization.
| In the |
In a |
|
|---|---|---|
| OWNER | ✅ | ✅ |
| Contributor | ❌ | ✅ |
| VIEWER | ❌ | ❌ |
The table shows that the owners can use the Advanced Editor to modify data sources both in the Organization and in a workspace. The viewers have no permissions to modify data sources, so they can't access the Advanced Editor.
Need more information about user roles in Slingshot? Check Roles & Permissions.
Who Can Use the Advanced Editor of a Certified Data Source?
The Certified column on the right of your data sources shows if they are certified or not. For certified data sources you will see one of the three badges: ![]() gold,
gold, ![]() silver or
silver or ![]() bronze. A crossed out badge
bronze. A crossed out badge ![]() means the data source is not certified.
means the data source is not certified.
Only certifiers can use the Advanced Editor and modify certified data sources. The default hierarchy of certification goes this way: gold > silver > bronze. This means that gold certifiers can modify all certified data sources, and bronze certifiers can modify only bronze certified data sources.
[!NOTE] If you don't see the Certified column on the right, select the plus icon
at the top of the data sources list. Make sure the box next to Certified is checked.
Working with the Advanced Editor
When you open the Advanced Editor, you will notice there are a lot of elements you can modify and information you can add, show or hide. The Advanced Editor is different for table data sources and cube (multidimensional) data sources. That's why we will look at each of them separately.
The Advanced Editor for Table Data
Most of the Slingshot data sources contain table data. Let's take a look at the Advanced Editor in detail.
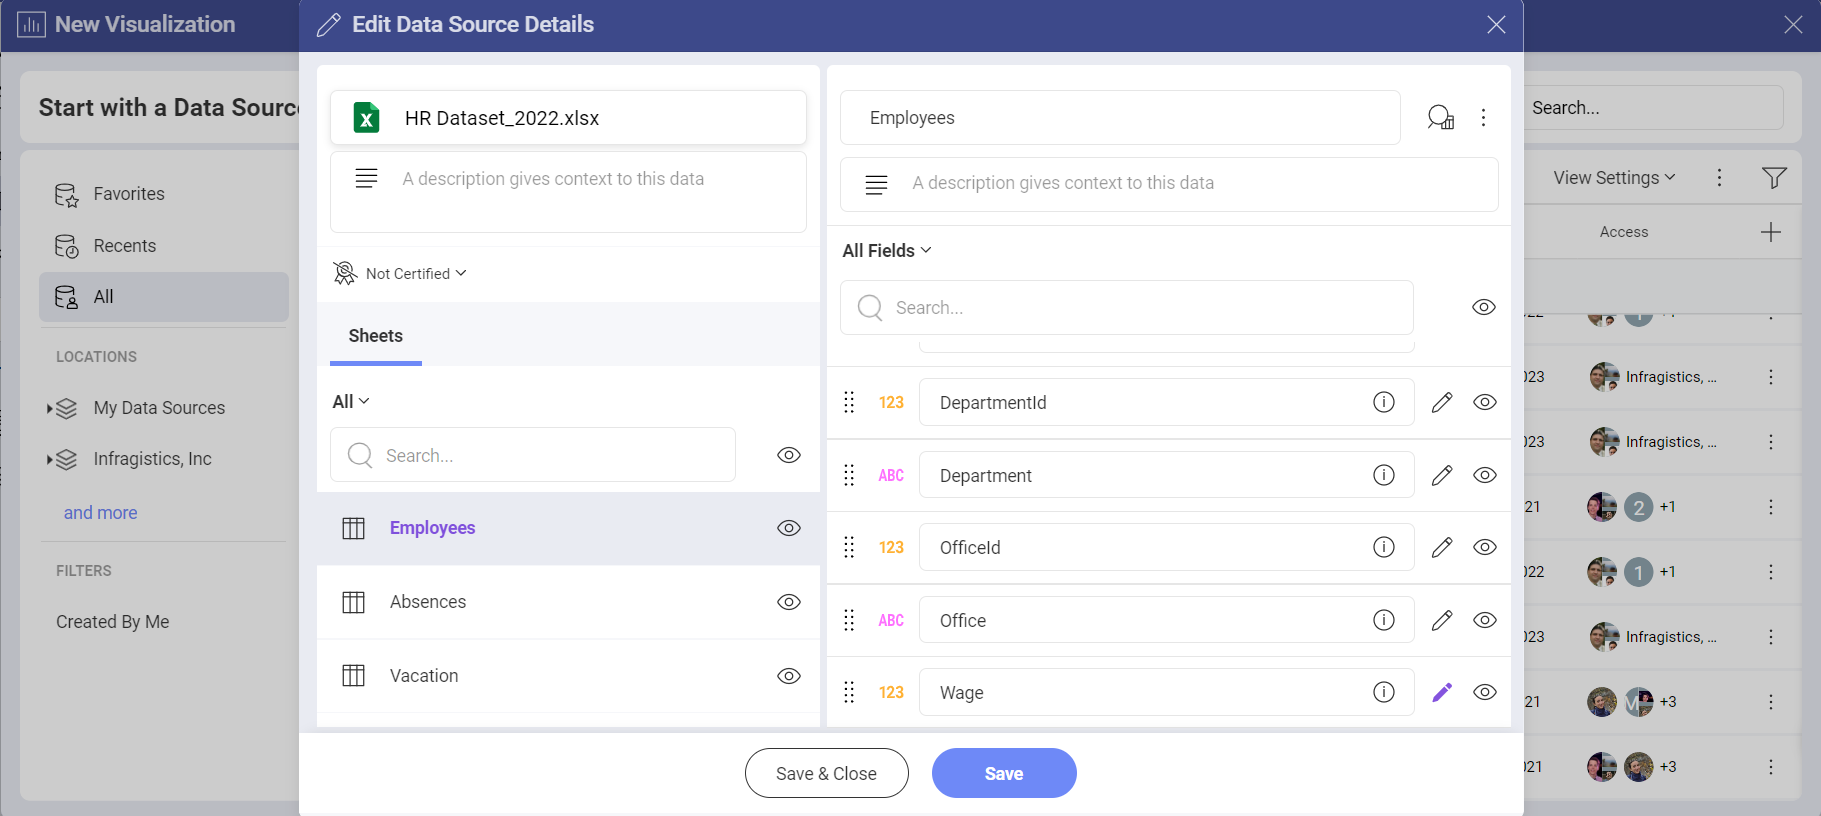
[!NOTE] This screenshot is just an example containing all the elements of the Advanced editor.
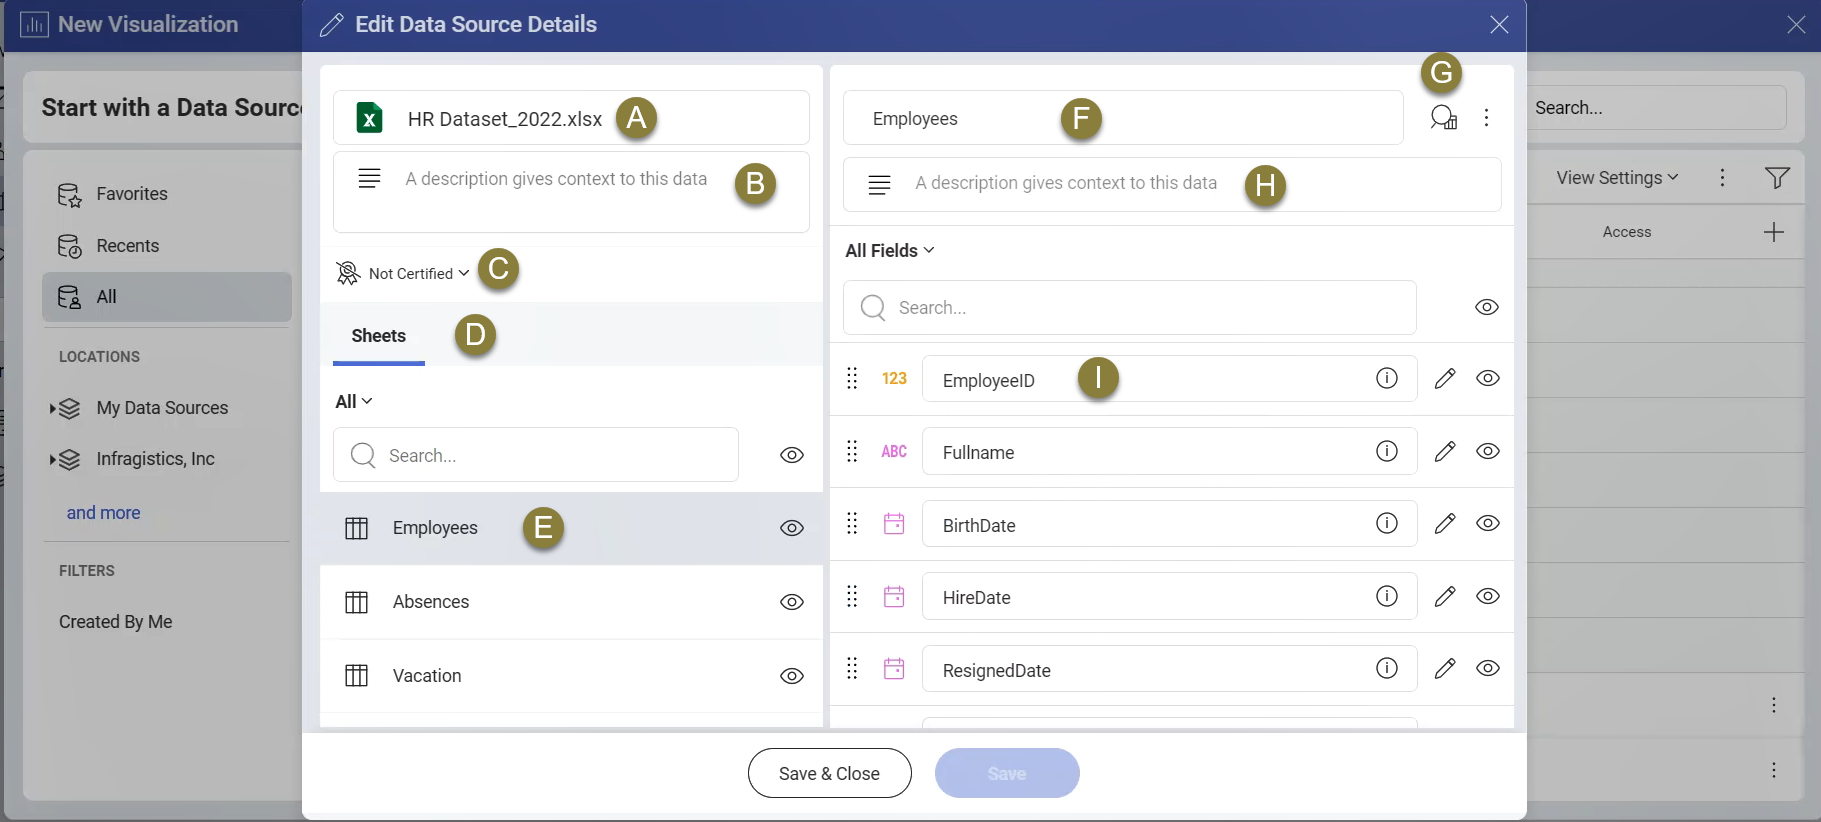
A. The data source's icon and title. You can rename the data source.
B. A description box. If you add text here, it will appear right under the data source in the data sources list.
C. Certification status. The badge icon shows if the data source is certified or not. If you are a certifier, you can select the icon and change the certification status.
D. The dataset types in your data source. For example, sheets, views, stored procedures, databases, entities, etc. You can switch between the objects.
E. A list of datasets you can edit. Select the dataset to see and modify the fields it contains.
F. The dataset's title. You can rename the dataset.
G. The dataset's description. The description will appear under the dataset's name in the data source details. It will help users decide which dataset to choose for their visualizations.
H. All the available data fields in the selected dataset. By hovering over the ![]() info icon, you will find out about a field's name, description, records in the first five rows, and original name and description. You can modify the information about each field - read below for more details. You can reorder the fields by dragging the dotted area next to each field.
info icon, you will find out about a field's name, description, records in the first five rows, and original name and description. You can modify the information about each field - read below for more details. You can reorder the fields by dragging the dotted area next to each field.
I. Preview of the data table. The preview shows the first 15 rows of the data table. There are two tabs in the preview:
- Catalog info - shows a preview of the data table in its latest state;
- Original - shows the original data table before any changes made with the Advanced editor.
H. The dataset's description. The description will appear under the dataset's name in the data source details. It will help users decide which dataset to choose for their visualizations.
I. All the available data fields in the selected dataset. By hovering over the ![]() info icon, you will find out about a field's name, description, records in the first five rows, and original name and description. You can modify the information about each field - read below for more details. You can reorder the fields by dragging the dotted area next to each field.
info icon, you will find out about a field's name, description, records in the first five rows, and original name and description. You can modify the information about each field - read below for more details. You can reorder the fields by dragging the dotted area next to each field.
The Advanced Editor for Data Cubes
The data sources that contain data cubes are:
Unlike table data sources, data cubes enable data to be modeled and viewed in multiple dimensions. This requires some differences in the organization of the advanced editor for data cubes.
Let's take a look at a screenshot showing the advanced editor of a Google Analytics data source.
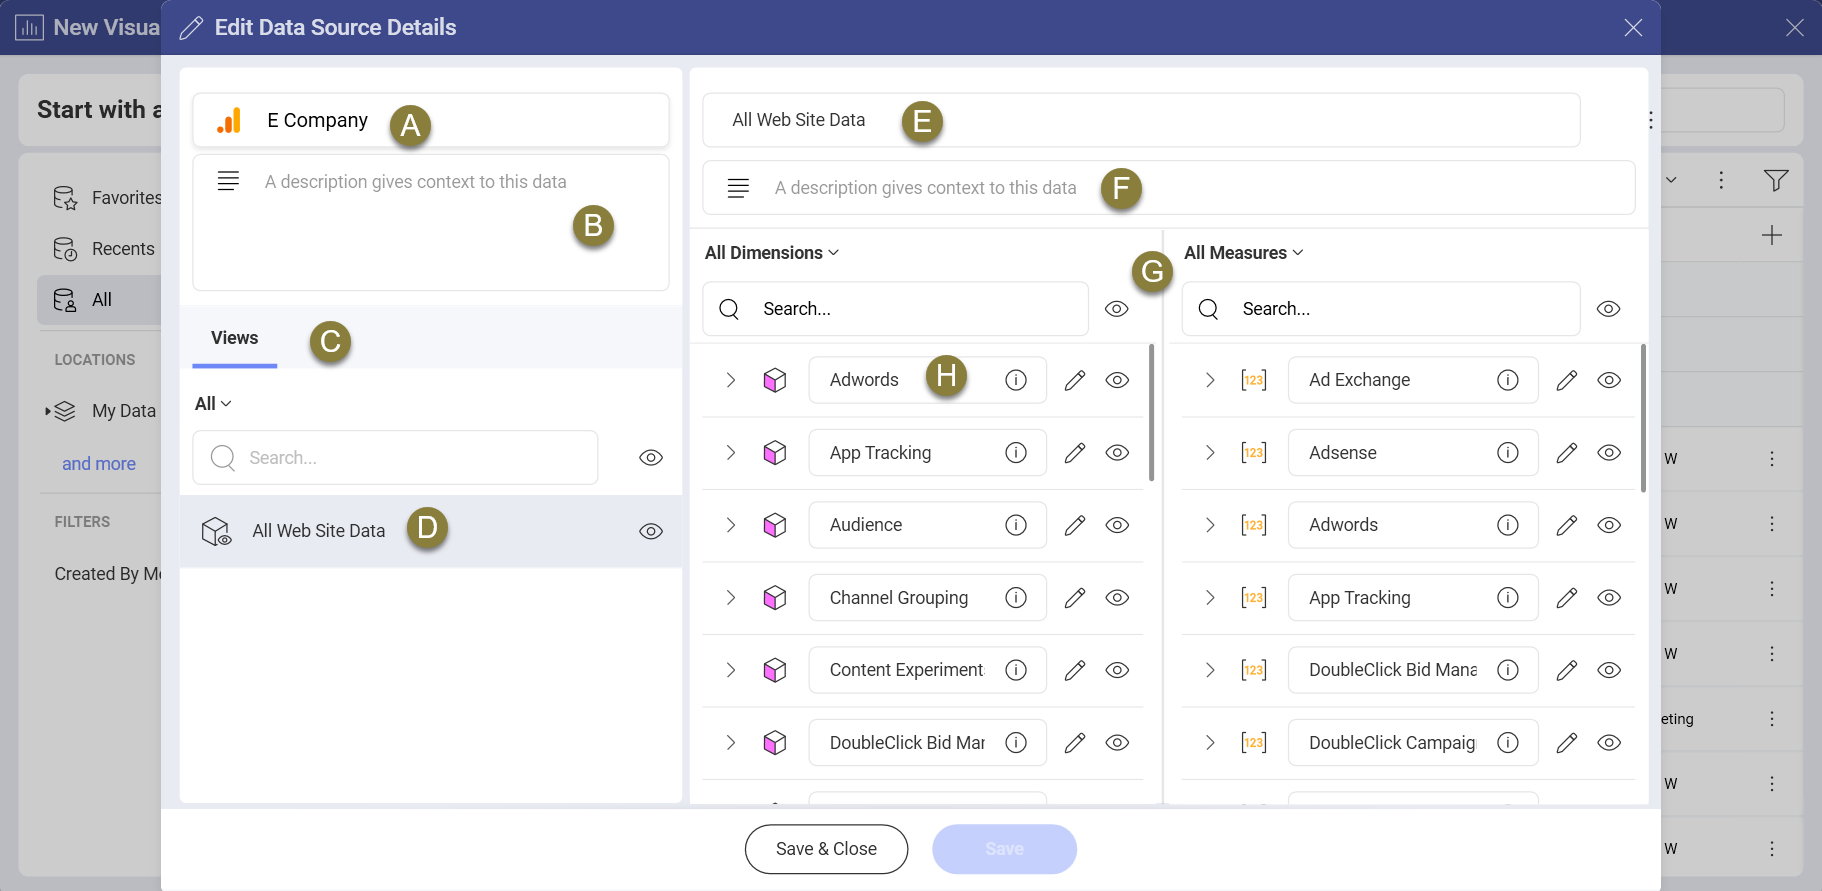
A. The data source's icon and title. You can rename the data source.
B. A description box. If you add text here, it will appear right under the data source in the data sources list.
C. The data cube types in your data source. For example, sheets, views, stored procedures, databases, entities, etc. You can switch between the objects.
D. A list of data cubes available. Select the cube to see and modify the data it contains.
E. The data cube's title. You can rename the data cube.
F. The data cube's description. The description will appear under the data cube's name in the data source details. It will help users decide which data cube to choose for their visualizations.
G. Dimensions and Measures are separated in two data columns for easier navigation.
H. All the available data in the selected data cube. You can see and modify the information of all dimensions, measures and of each element inside a dimension/measure. Hovering over the ![]() info icon, will show you the "unique name of the element", and a description of the dimension/measure. You can modify this information. You can't reorder the elements.
info icon, will show you the "unique name of the element", and a description of the dimension/measure. You can modify this information. You can't reorder the elements.
Data preview is not available for cubes.
[!NOTE] Google Analytics data sources specifics. Hierarchies inside the dimensions are not shown, the elements are shown individually in the advanced editor. A "unique name of the element" is not available. The descriptions of the elements are the default descriptions from Google Analytics.
Hiding Data with the Advanced Editor
The hiding capability is really useful for teams that deal with huge amounts of data. If this data is spread over, let's say, hundreds of spreadsheets, but you usually use only two of them for your visualizations, why digging them up every time? Hiding all unnecessary sheets in the Excel file will boost your team's productivity.
The Advanced Editor allows you to hide:
Entire data tables and data cubes.
Individual data elements such as text and numeric fields, dimensions and measures.
If you see the eye icon next to a data element, this means you can hide it by selecting the icon. If you see the closed eye, this means the element is already hidden.
Editing Data with the Advanced Editor
Select the ![]() pencil icon next to a data field or a dimension or measure element. This will open the field settings on the right.
pencil icon next to a data field or a dimension or measure element. This will open the field settings on the right.
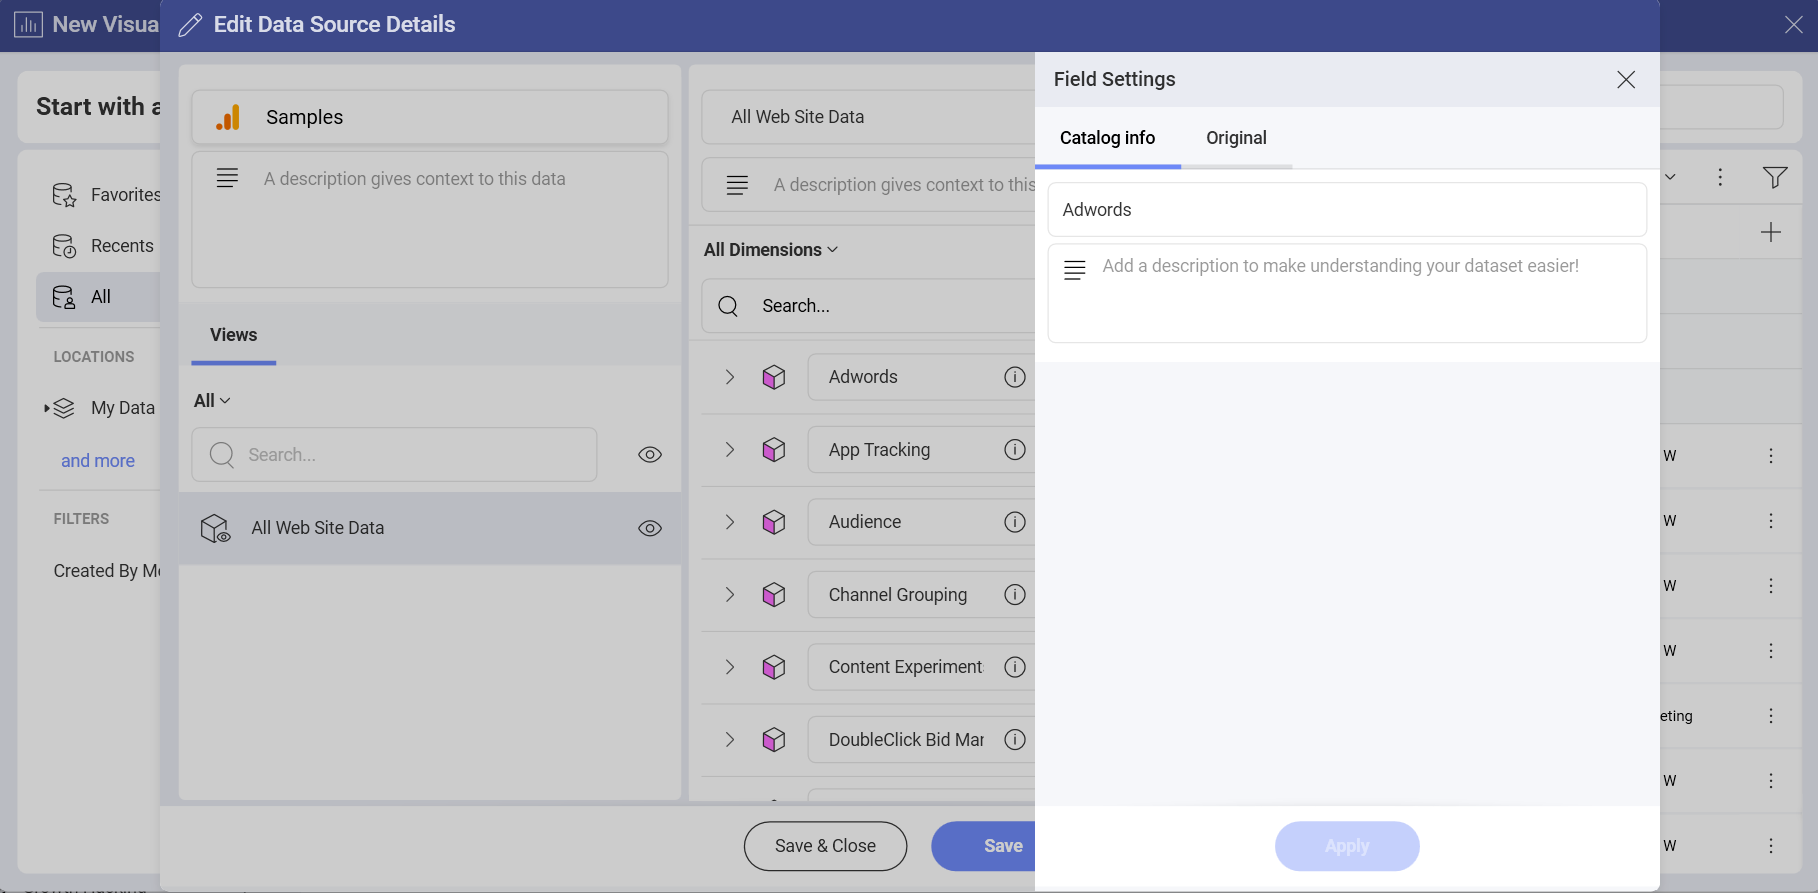
In the Catalog info tab, you will be able to change the name and the description of the data field. Switch to the Original tab to see the name and description of the field before any changes made with the Advanced Editor.
[!NOTE] You can search for a data field both by its original and current name.
Data tables, cubes and fields that contain modified information are colored in purple.
Changing the Default Formatting of Numeric Data
Select the ![]() pencil icon next to numeric data to quickly change the default format from Number to Currency or Percent. You can also modify fraction digits number and choose to apply the 1000 separator.
pencil icon next to numeric data to quickly change the default format from Number to Currency or Percent. You can also modify fraction digits number and choose to apply the 1000 separator.
After changing the formatting, the data table or data cube that contain the numeric data will be colored in purple.
The icon in front of the numeric field will also change to a currency symbol or percent sign accordingly. This change will be visible in the Visualization editor as well (see below).
If necessary, you can once again change the default formatting of the field when using it in the Visualization editor. To do this, drag the field to the Values placeholder and click/tap to open the Field Settings dialog (see below).
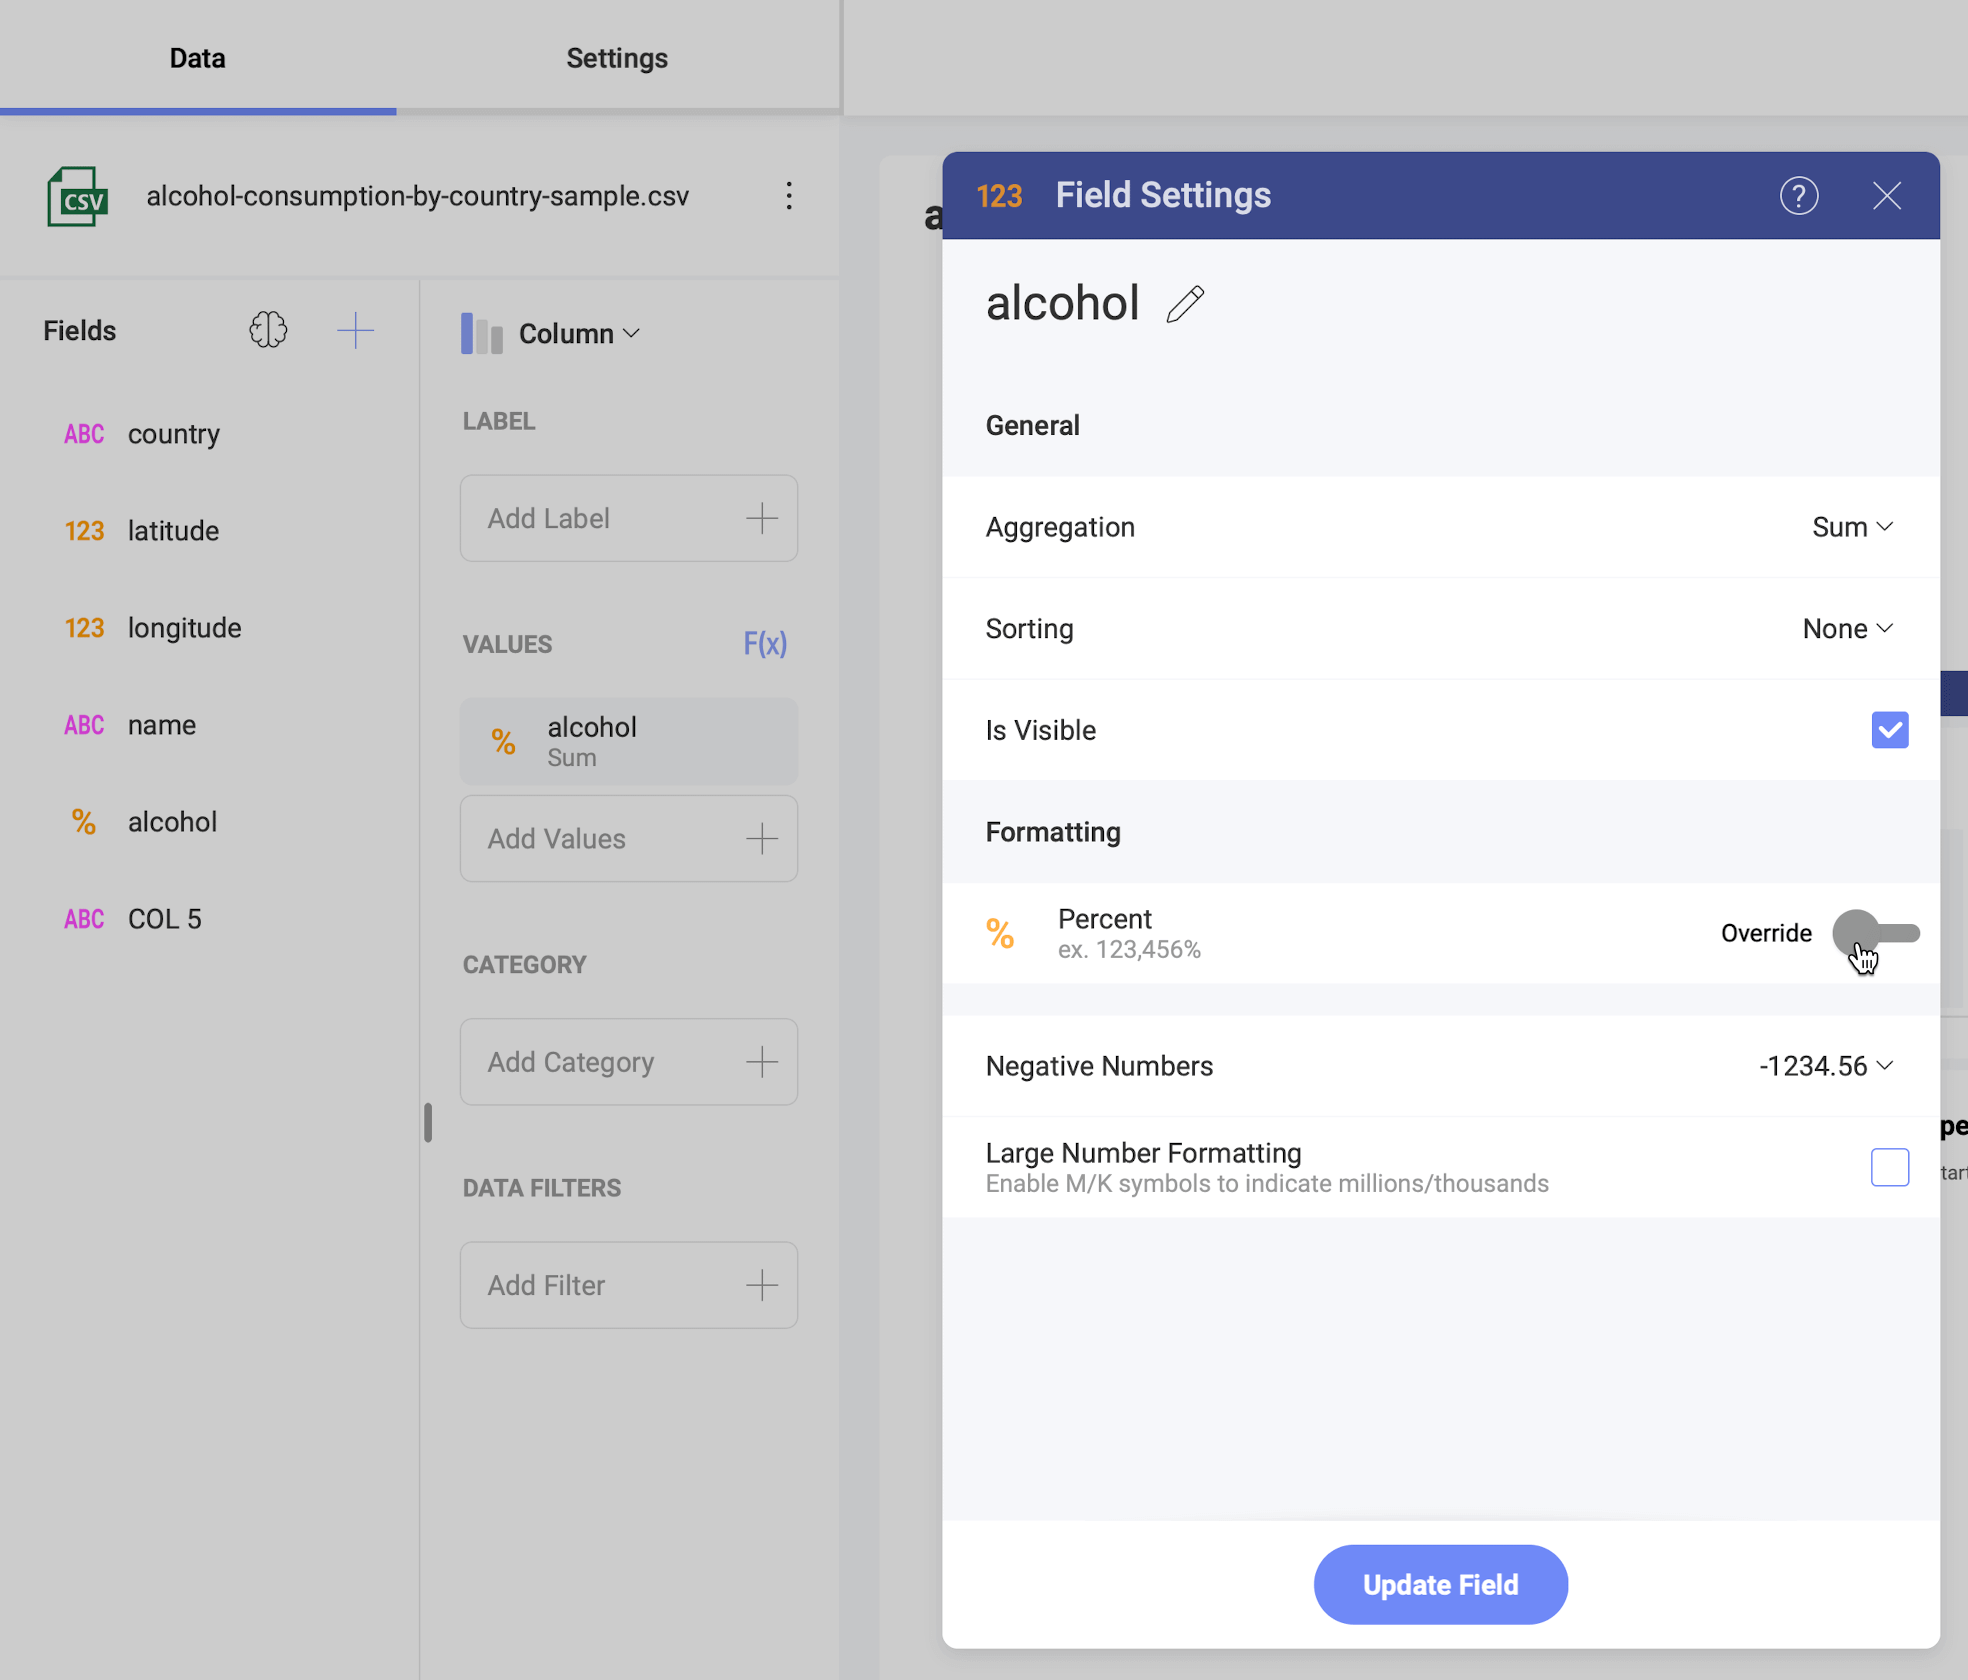
Select the Override toggle to be able to modify the formatting settings.
[!NOTE] If the data source is certified, only certifiers can change and override the default formatting of numeric data.