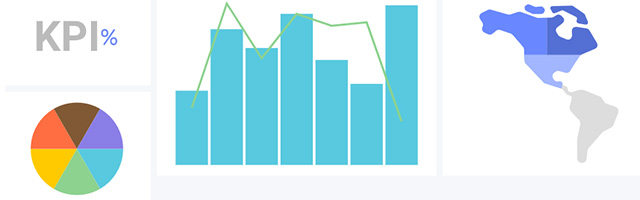

How Stephen Gould Scaled Its Capacity by 30% without Making a Single Hire

Use the Sales Forecasting Template to connect pipeline data, deal execution, and team activity in one place, so your forecast always reflects what’s actually happening.

Project revenue based on real pipeline data
Track deal movement and activity levels
Visualize forecast vs. target in real time
Connect sales execution to revenue outcomes


A sales forecasting template is a structured system for estimating future revenue based on active deals, pipeline stages, and expected close dates.
Most sales forecast templates rely on pipeline data alone. That creates a gap between what looks likely to close and what actually closes.
A modern sales projections template should include:
Pipeline data
Deal movement
Sales activity
Execution tracking
Without these inputs, forecasts become static reports instead of decision-making tools.
Forecasting is not a data problem. It is an execution and visibility problem.
A forecast should reflect real pipeline activity, deal progress, and execution — not static snapshots of open opportunities. A reliable sales forecasting template should show what is happening inside the pipeline in real time, not just deal value.
A strong forecast includes:
Deal progression
Activity levels
Stage movement
Timing and execution
Most sales forecast spreadsheets rely on snapshots of pipeline data. That approach works for reporting, but it breaks when deal behavior changes.
If a deal has not moved, has no recent activity, or lacks follow-up, it should not carry the same weight in your forecast. A forecast built only on stages cannot show momentum, surface risk early, or help you adjust in time.
Forecasts often fail for predictable reasons. The problem is not usually that teams lack enough information — it is that the information they use is incomplete, disconnected, or outdated.
Forecasts Based on Static Data
Many teams build forecasts from pipeline stages and win probabilities. That can produce a number, but it does not guarantee accuracy. Deals do not always move according to plan, and a forecast based only on pipeline snapshots can miss critical changes in buyer behavior or rep activity.
No Visibility Into Deal Activity
A pipeline view may show deal value and stage, but not what the team is actually doing to move the deal forward. Without activity context, it is difficult to know whether a deal has momentum or needs attention.
Manual Forecasting Processes
Spreadsheets require frequent updates, yet they often fall behind. Manual forecasting creates extra work, introduces risk, and makes it harder to keep leaders aligned on current numbers.
Disconnected Systems
When pipeline data, activity tracking, and reporting live in separate tools, forecasting becomes fragmented. Leaders end up stitching together reports rather than relying on a single system of record.
Most teams start with a sales forecast spreadsheet. It works early on but breaks as complexity increases.
Spreadsheets:
Manual updates
Static pipeline snapshots
No activity tracking
High risk of errors
This sales forecasting template:
Real-time pipeline updates
Activity-based forecasting
Execution visibility
Automated calculations
The difference is simple. A spreadsheet shows what you entered. A system shows what is actually happening.
This sales forecasting template provides a structured approach to forecasting revenue, tracking pipeline health, and connecting execution to outcomes. It’s designed to help users move from reactive forecasting to a more consistent, execution-based process.
Forecast Tracking
Project revenue based on:
This helps teams establish a forecast that is grounded in real opportunities rather than guesswork.
Pipeline Visibility
Track:
This gives leaders a clearer view of where deals are concentrated and where progress may be slowing.
Activity-Based Context
Understand:
This adds the execution layer that many forecasting tools miss.
Forecast Dashboards
Visualize:
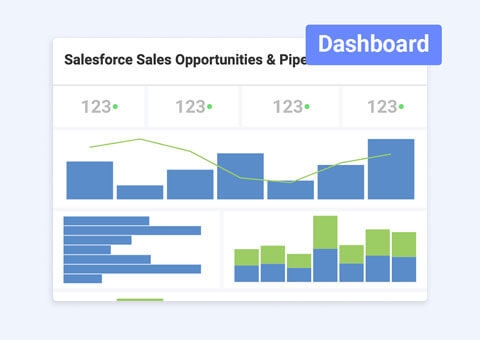
Dashboards make it easier to review performance and spot gaps in one place, before they become misses.
Inaccurate Forecasts:
Forecasts improve when tied to activity.
Lack of Visibility:
See both pipeline and execution in one place.
Slow Adjustments:
Respond quickly to changes as deals move.
Manual Reporting:
Automate forecasting with real-time data instead of rebuilding reports each week.
This workflow helps teams stay current without having to rebuild the forecast from scratch each week. It also gives managers a repeatable way to review performance and direct attention where it is needed most.
This revenue forecasting template connects forecasts directly to deal activity and execution, so the numbers reflect what is actually happening.
Most forecasting tools rely on pipeline snapshots, manual updates, and limited execution visibility. That leaves leaders with a number, but not the context behind it.
Slingshot connects forecasting to execution so teams can see:
You see what is behind the number and what needs attention before it impacts results. Instead of choosing between speed and accuracy, the template helps create a better balance between the two.
It is especially useful for teams that need a template, a system, and a solution now — a strong fit for bottom-funnel users who are actively looking for a forecasting model they can put to work right away.
Explore our collection of ready-to-use templates, carefully crafted to cater to the needs of multiple use cases and departments. Save time and effort by trying out the template that suits your workflow best. It only takes a few clicks to get started.
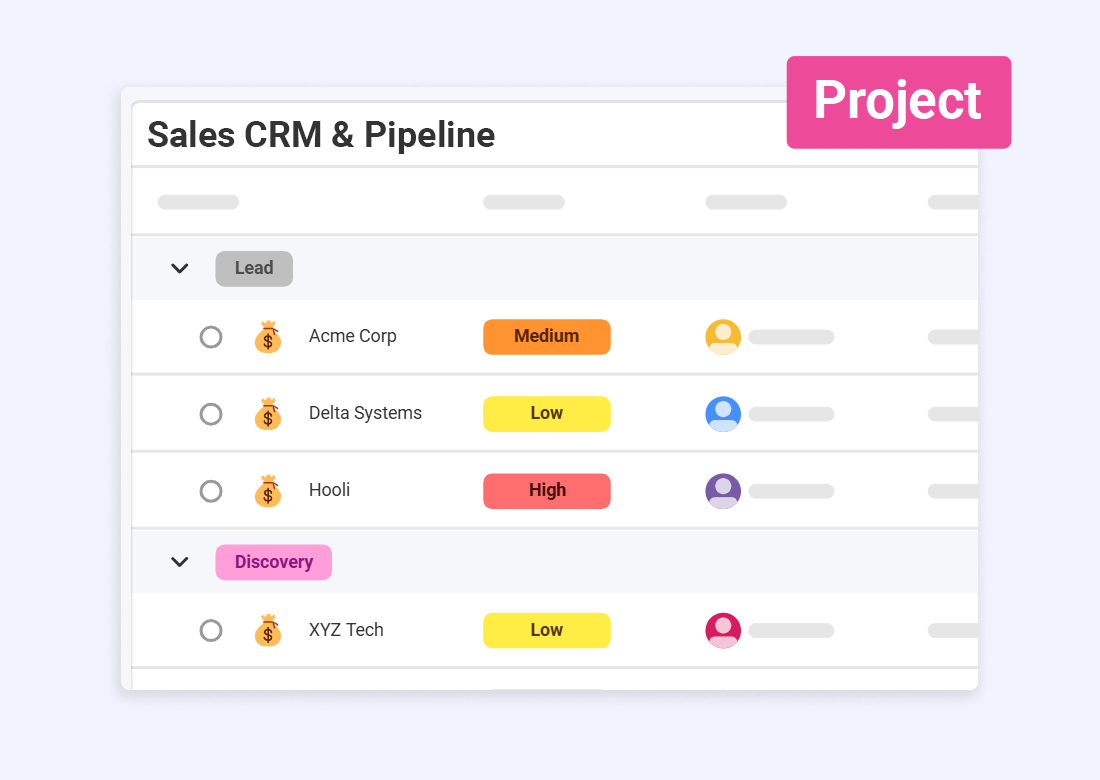
Manage your pipeline, track deals through each stage, and stay on top of sales performance with ease.
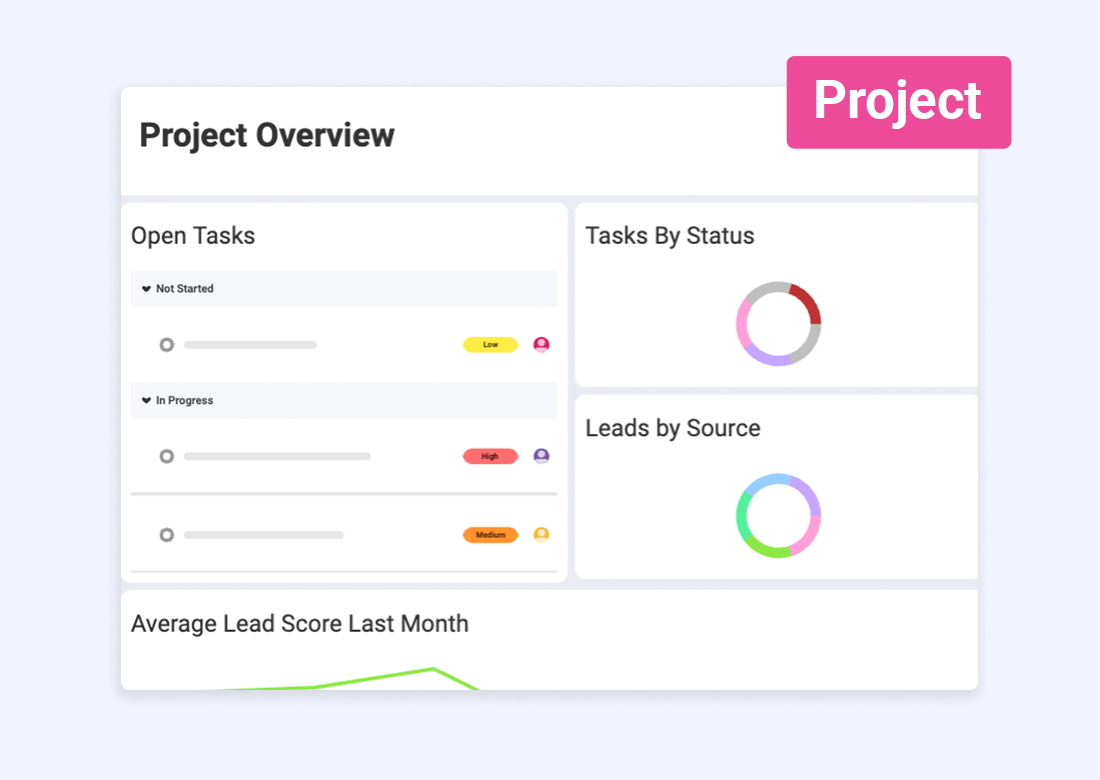
Capture and track leads, manage follow-ups, and gain visibility into pipeline progress.
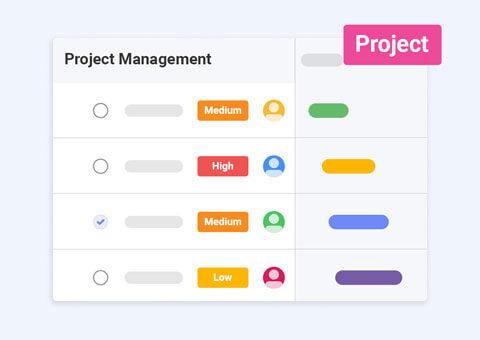
Seamlessly manage tasks, teams, and projects of any complexity from start to finish.
Simplify the process of analyzing key metrics, optimizing email campaigns.
Connect pipeline data, activity, and forecasting in one system so you can see what will close and why.
Use Template Use Template Use Template