How Stephen Gould Scaled Its Capacity by 30% without Making a Single Hire

MLB Residential Lending serves the lending needs of home buyers, home owners, real estate professionals and builders with 14 branches in the Northeast and an active pipeline of 500 loans.
saved per month by eliminating design agency
less time spent on creating visualizations
Mortgage lenders live and die by numbers, from loans in the pipeline, to loans closed, to margins and more. But for many mortgage lenders, this data is not easy to see or act on. It’s often crammed into multiple Excel spreadsheets or other databases that take time to organize, review, and interpret.
MLB was paying an outside agency $8000 per month to turn its Excel files into specific charts for a weekly executive meeting. But according to Travis Rotondo, IT Applications Manager at MLB, “it could take up to 4 weeks of back-and-forth before I felt confident the charts were accurate. And still the quality of the visualizations was unexceptional.”
In addition, MLB was not fully using the power of the data. So much time was spent preparing the data that there was no time to analyze the data and take steps to act on the insights learned.
Now we visualize key data points in clear, beautiful charts and dashboards that I create in less than 30 minutes.
Travis Rotondo, IT Applications Manager at MLB
Once Travis began using Slingshot, the digital workplace that connects everyone to each other and to data, content, projects and chats, his approach changed dramatically.
“The day I began using Slingshot, I essentially had the dashboards built and ready to show that same day — it was a huge thing!
“Now, we visualize key data points in clear, beautiful charts and dashboards that I create in less than 30 minutes with Slingshot,” says Travis. “Not only can I see the data quickly, but I can share it and present it to MLB executives which allows all of us to view and analyze the insights more easily and take action to help drive our business forward.”
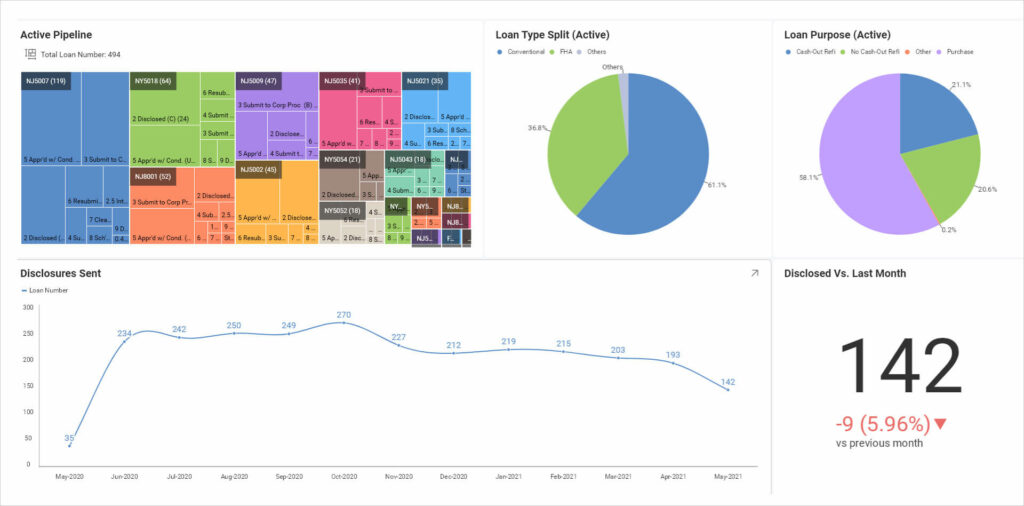
Using Slingshot’s integrated data analytics feature, Travis creates a single dashboard that includes a striking display of multiple easy-to-read charts and graphs (see illustration).

The Treemap chart displays MLB’s active pipeline of loans by branch and uses color coding so viewers can quickly see which office is over- or under-performing. Clicking on the chart takes viewers deeper into the data for more granular analysis.
The dashboard also presents a quick snapshot of loans by type (conventional vs FHA) or purpose (cash-out refi, no cash-out refi, purchase or other) with more details accessible with a click.
“With these visualizations, we can take a snapshot of the company as a whole and evaluate where we are versus our goals or past results.”
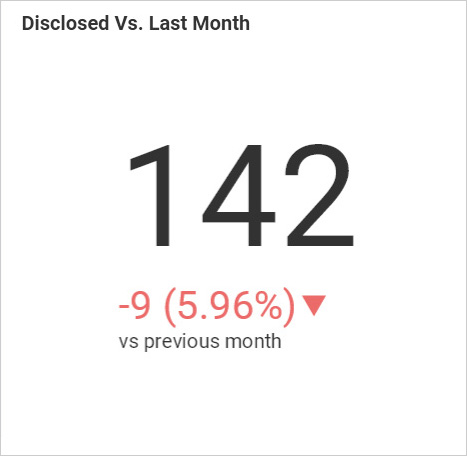
Slingshot’s simple KPI visualization appears to be a lonely number, but it is especially powerful. “The Loans Disclosed KPI is simple but it reveals so much,” says Travis.
“It tells us how many loans have closed that month in a single large number but also provides an instant comparison percentage below the number with the previous month’s closures and color codes it. We can then turn these insights into action — initiating a promotional campaign, for example, to drive those numbers up.”

We turn insights into immediate action — initiating a promotional campaign to drive up lagging numbers.
Travis Rotondo, IT Applications Manager at MLB
While Slingshot’s data analytics feature is impressive, it is only one part of a comprehensive all-in-one digital workplace for team collaboration. MLB has begun using the annotation and discussion feature in Slingshot. Travis created a team space for the performance metrics and invited the executive staff. Now, others are notified when the dashboard is ready, and they can visit and ask questions or begin group discussions around the key data points.
“We are just starting to use the collaboration feature more aggressively,” says Travis. “But our CEO was already impressed when he was out to dinner and realized he could view the dashboard and charts on his mobile device – and quickly add his comments and questions at any time and from anywhere. Slingshot is allowing us to engage much faster than we could ever before.”
The ability to visualize and act on data faster is transforming MLB’s ability to respond to signals from the market and from customers. This will have a direct impact on the company’s bottom line.
Slingshot is also directly saving MLB time and money.
“Before Slingshot, we used other BI systems that were complex and I’d have to rely on analytics guys to make charts look good for executive meetings,” adds Travis, “and it took weeks as we went back and forth until I was satisfied. The day I got Slingshot I essentially had the dashboards up and built and ready to show that same day – it was a remarkable improvement, we love Slingshot.
“It also let us eliminate the outside agency, saving us $8000 each month, so we’re excited about Slingshot now and moving forward.”
MLB now has the data analytics they need for informed decision making, as well as a digital workplace with the ability to connect everyone on the team with company-wide collaboration and insights.
Inspire success with the most powerful team-enhancing software.
