How Stephen Gould Scaled Its Capacity by 30% without Making a Single Hire
In this article, we make sure we show you the right steps to choose the best chart for your data, so your insights can always be used in the best way to get results.
Executive Summary:
In this article, we make sure we show you the right steps to choose the best chart for your data, so your insights can always be used in the best way to get results.
The amount of data at our fingers tips today can be overwhelming. How do you know what really matters?
Two words: data visualizations.
But when you’re choosing how to display your data, there are so many questions to answer.
How can you set up your data to best visualize it? What chart will help you analyze it?
Which one makes the data most meaningful? Are you measuring performance? How many variables do you have? Is your data time-based? Geospatial? And so on…
In this article, we make sure we show you the right steps to choose the best chart for your data, so your insights can always be used in the best way to get results.
Let’s start with the basics – what is a data chart?
A data chart is a visual representation of a set of numerical data points that can be represented in the form of bars, lines, slices of a pie, symbols, and more. The most popular types of data analytics charts are:
As consumers or businesses contend with the explosion of more complex information, we need to help them understand it faster. This is where the right chart comes in to help you best get your message or data story across. While your data could potentially work with multiple charts, it is up to you as the creator to make sure you are selecting one that makes the data clear and concise for the consumer.
Consider these key questions to help guide you in your choice:
There are 4 basic chart types when it comes to presenting your data:
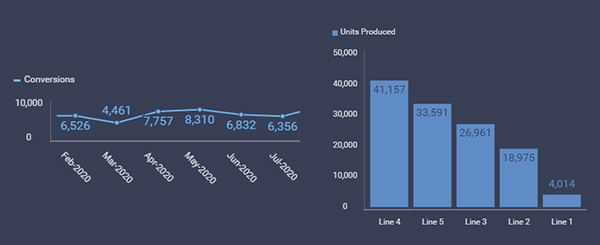
A comparison chart draws a comparison between two or more variables. These can be used to effectively show your end users differences between two or more set of variables over time. So what types of charts do you use to compare data?

The best chart types to use for comparing data are:
Now that you know what type of chart to use for your data, be sure to follow best practices like using proper color and text, highlighting what’s important and other techniques you can find in our whitepaper.
A composition chart is best for showing how individual variables make up a whole. You can either show the relationship of these variables over time or as a static sum.

The best charts for tracking changes of variables over time are:
The best charts for measuring static relationships of variables are:
All of these chart types allow you to set up drill-downs to drill into hierarchies in your data and even gain deeper insights.
Some best practices to keep in mind when using these charts are:
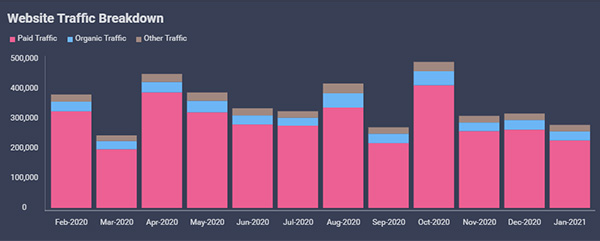
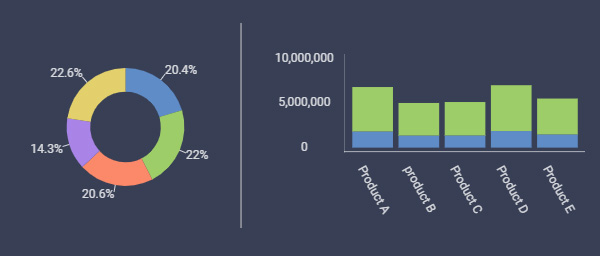
Charts like stacked columns and stacked area, for example, sre great for showing the parts to a whole over time to allow you to compare changes and trends. Charts like pie charts and donut charts are best for comparing values as a sum.
A distribution chart shows how a set of quantitative values are distributed across an entire range and helps you identify key outliers and trends in your data. Say you have a set of values and you want to know if there is a correlation between them by seeing any intersections. It is best to use any of the following charts:

The best charts for distribution data are:
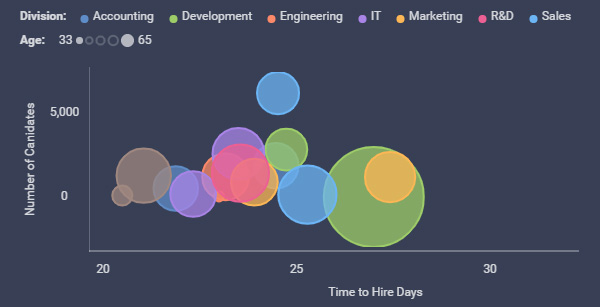
A relationship chart will show a correlation between two or more variables through the data you pull together. This can be used to show either a positive or a negative effect that the given variables exert on each other. The below charts are best when you have two or more variables:

Best Practices with Data Visualizations
When it comes to creating data visualizations, choosing the right chart type is just one part of the puzzle!
SHARE THIS POST