
How Stephen Gould Scaled Its Capacity by 30% without Making a Single Hire
Startups need business intelligence tools that are simple, scalable, and fast to deploy. Tools that delay insights or require technical overhead slow growth. Platforms that combine data with workflows help teams move faster and stay aligned. Slingshot offers a full-stack approach by combining dashboards, collaboration, and execution in one place. Reveal stands out for SaaS teams looking to embed customer-facing analytics with a predictable, developer-friendly integration.
Executive Summary:
Startups need business intelligence tools that are simple, scalable, and fast to deploy. Tools that delay insights or require technical overhead slow growth. Platforms that combine data with workflows help teams move faster and stay aligned. Slingshot offers a full-stack approach by combining dashboards, collaboration, and execution in one place. Reveal stands out for SaaS teams looking to embed customer-facing analytics with a predictable, developer-friendly integration.
Most startup teams struggle with scattered data, unclear metrics, and tools that don’t talk to each other. Whether you’re leading product, ops, or growth, you’re expected to make fast decisions with incomplete visibility. Traditional BI platforms are often too slow to set up, too complex to use, or too disconnected from execution.
That’s why choosing the right tool early matters. You need something that gives your team answers fast, works across roles, and scales as you grow.
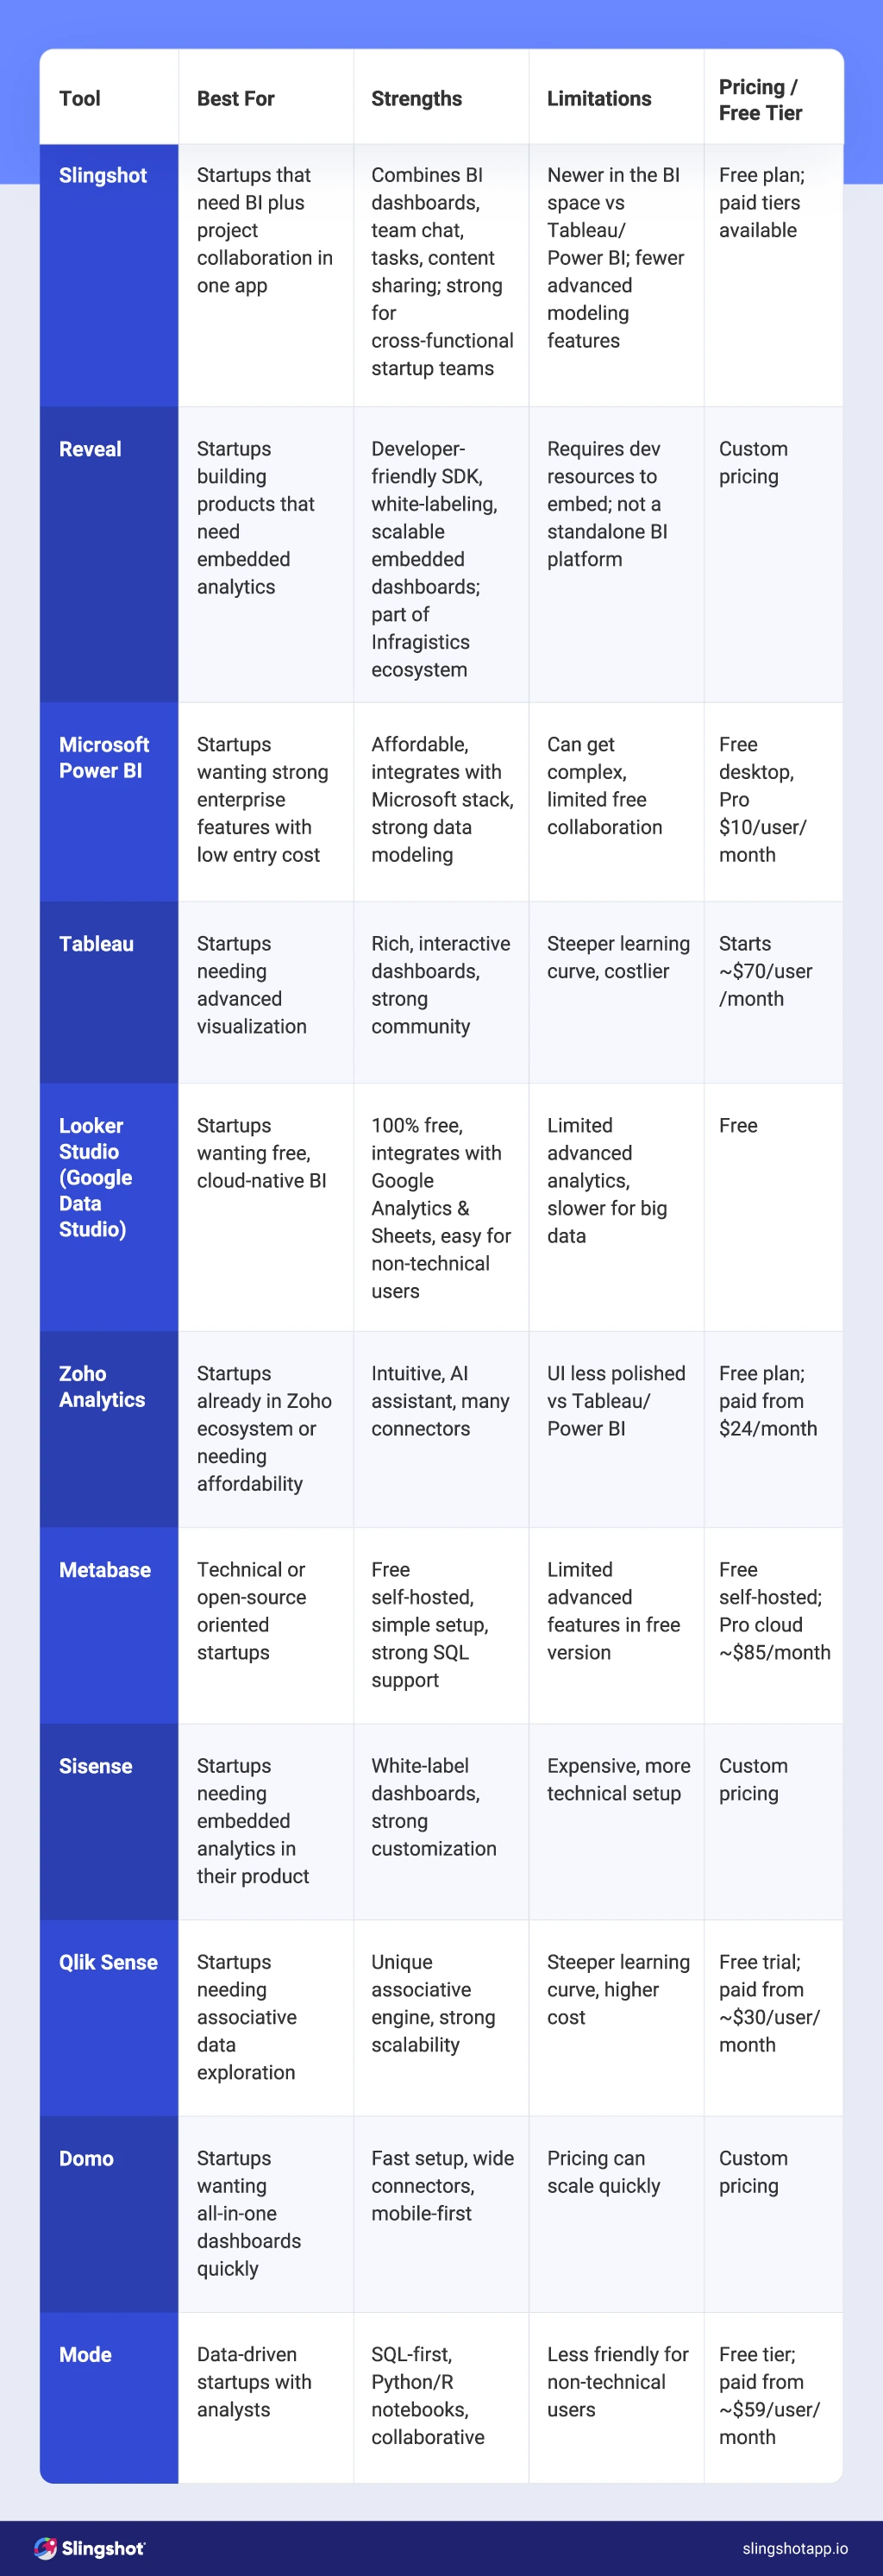
To help you compare, we’ve broken down the top business intelligence tools for startups based on what matters most to early-stage teams.
Each platform is ranked across these features:
| Tool | Free Plan & Pricing | Ease of Use | Workflow Integration | Integrations | AI | Deployment & Scalability | Limitations |
|---|---|---|---|---|---|---|---|
| Slingshot | Free + Tiered | Very Easy | Full Work Management | Extensive | Embedded: Full | High scalability | — |
| Power BI | Per User + Usage | Moderate | Some Collaboration | Extensive | Embedded: Partial | High scalability | Slower at scale |
| Tableau | Per User / Usage | Steep Learning | Some Collaboration | Extensive | Embedded: Partial / Full (embed) | High scalability | Slower at scale |
| Looker Studio | Free | Very Easy | Some Collaboration | Extensive | Embedded: Partial | Moderate scalability | — |
| Zoho Analytics | Free + Tiered | Easy | Some Collaboration | Extensive | Embedded: Partial | Moderate scalability | — |
| Metabase | Free + Tiered | Easy / Moderate | Some Collaboration | Moderate | Embedded: Partial | Moderate scalability | Moderate / Slower at scale |
| Sisense | Custom / Enterprise | Moderate / Hard | Some Collaboration | Extensive | Embedded: Full | High scalability | Variable performance |
| Qlik Sense | Per User + Capacity | Moderate / Hard | Some Collaboration | Extensive | Embedded: Partial / Full (embed) | High scalability | Slower at scale |
| Domo | Consumption / Credit-based | Moderate / Easy | Full Work Management | Extensive | Embedded: Partial / Full (embed) | High scalability | Slower under heavy loads |
| Mode | Free + Tiered | Moderate / Hard | Some Collaboration | Extensive | Embedded: Partial | Moderate / High scalability | Slower under load |
| Reveal | Flat rate | Easy | Some Collaboration | Moderate | Embedded: Full | High scalability | — |
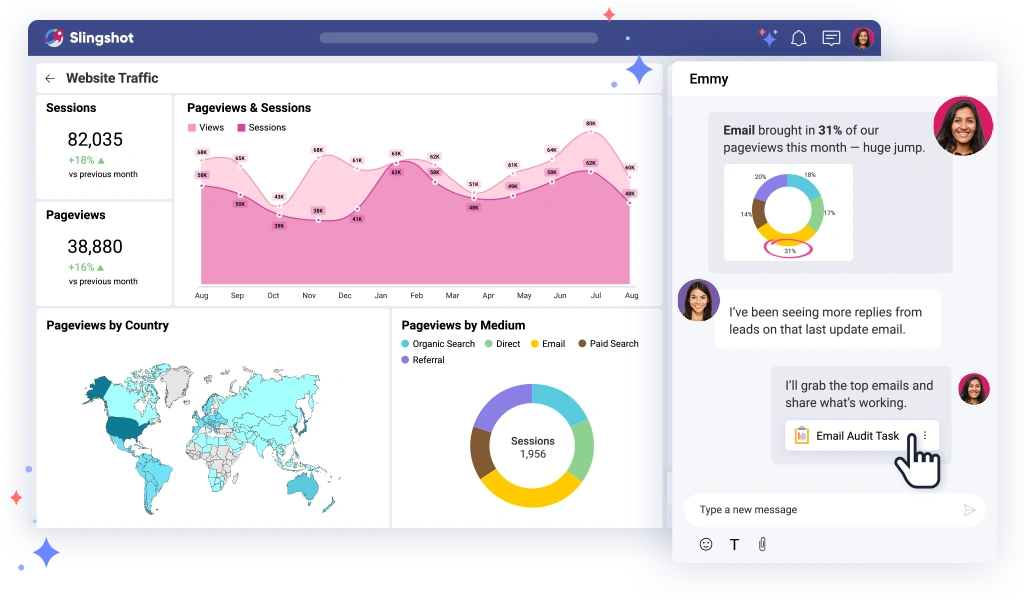
Slingshot is a modern, AI-powered work management and analytics platform that brings data, people, and projects into one space. It’s built for startups that want faster insights without adding more tools or technical debt. While many business intelligence tools for startups focus only on dashboards, Slingshot connects real-time data to team execution, so you don’t just see the numbers; you act on them.
Strengths
Limitations
What Makes It Stand Out
Best For:
Slingshot works best for growing startups that want to connect data to daily work. If you’re looking to replace multiple apps with one platform that delivers insights, drives action, and keeps your team aligned, it’s a strong fit. Especially relevant for teams trying to scale operations without hiring a full-time analyst.
Pricing
Free plan available. Paid tiers with additional features and users.
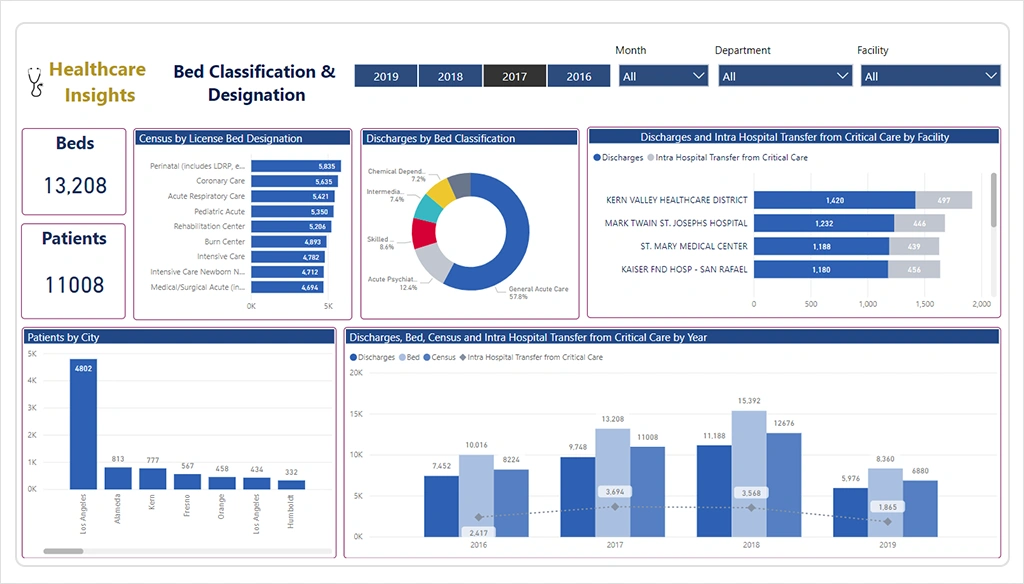
Power BI is Microsoft’s flagship business analytics tool, widely used by companies of all sizes for creating reports, dashboards, and visualizations. For startups, it offers a familiar experience, especially for teams already in the Microsoft ecosystem. But Power BI has a steep learning curve. While powerful, it may be more than what some early teams need from data analytics for startups.
Strengths
Limitations
What Makes It Stand Out
Best For:
Power BI is a solid choice for technical teams that need powerful BI and are already using Microsoft products. It’s less suited to startups looking for all-in-one simplicity or built-in collaboration, but it excels when embedded in a structured reporting workflow.
Pricing
Free desktop version available. Pro starts at $10/user/month. It charges additional costs for premium and embedded use.
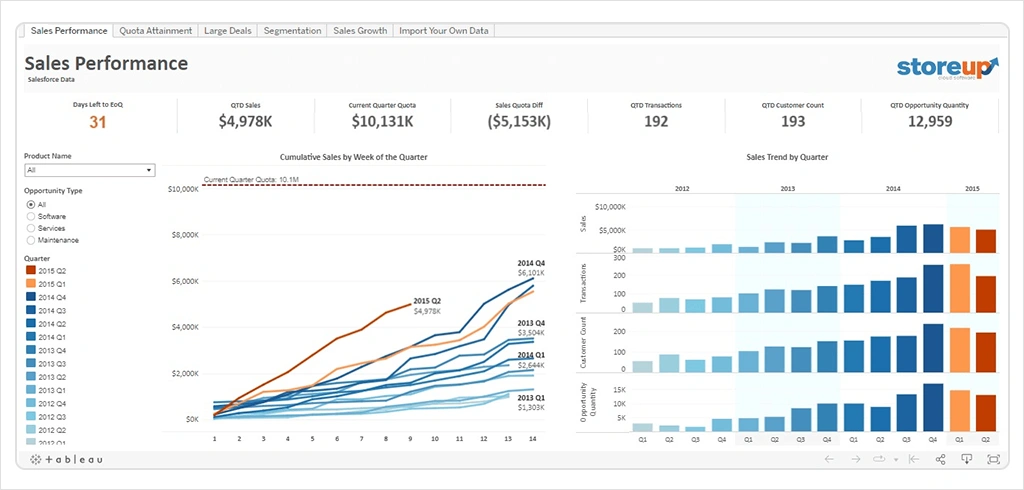
Tableau is one of the most recognized names in business intelligence, known for its powerful visualizations and ability to handle complex data. It’s popular among data teams and larger startups that need more customization and are comfortable with steeper learning curves. While it delivers deep insights, Tableau may be more than most startups need early on.
Strengths
Limitations
What Makes It Stand Out
Best For:
Tableau works best for data-savvy startups with analysts or technical users on board. If your team needs detailed, high-impact dashboards and has time to build them. It’s a strong contender. Less ideal for early-stage teams looking for simplicity or speed.
Pricing
Starts around $70/user/month. Viewer and Explorer roles are available at lower rates.
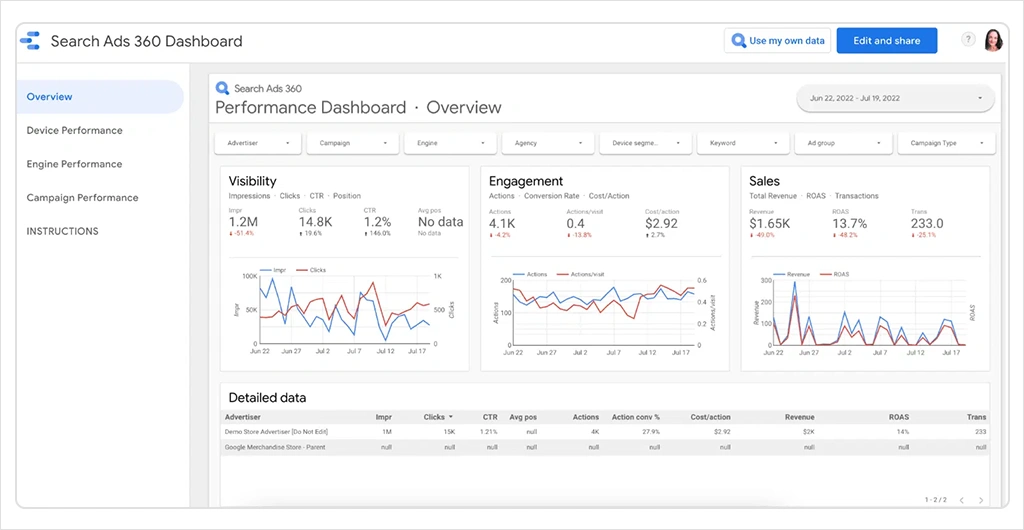
Looker Studio is Google’s free cloud-based business intelligence tool, designed to make data visualization more accessible. It’s especially appealing for early-stage startups that want to get dashboards up and running fast, without committing to expensive software. While it lacks some depth, it’s a go-to entry point for data analytics for startups.
Strengths
Limitations
What Makes It Stand Out
Best For:
Looker Studio is great for startups that need to visualize and share data quickly without cost or complexity. It’s best used for lightweight dashboarding and reporting, not deep analytics or multi-team collaboration.
Pricing
Completely free. Looker Studio Pro offers enhanced admin features.
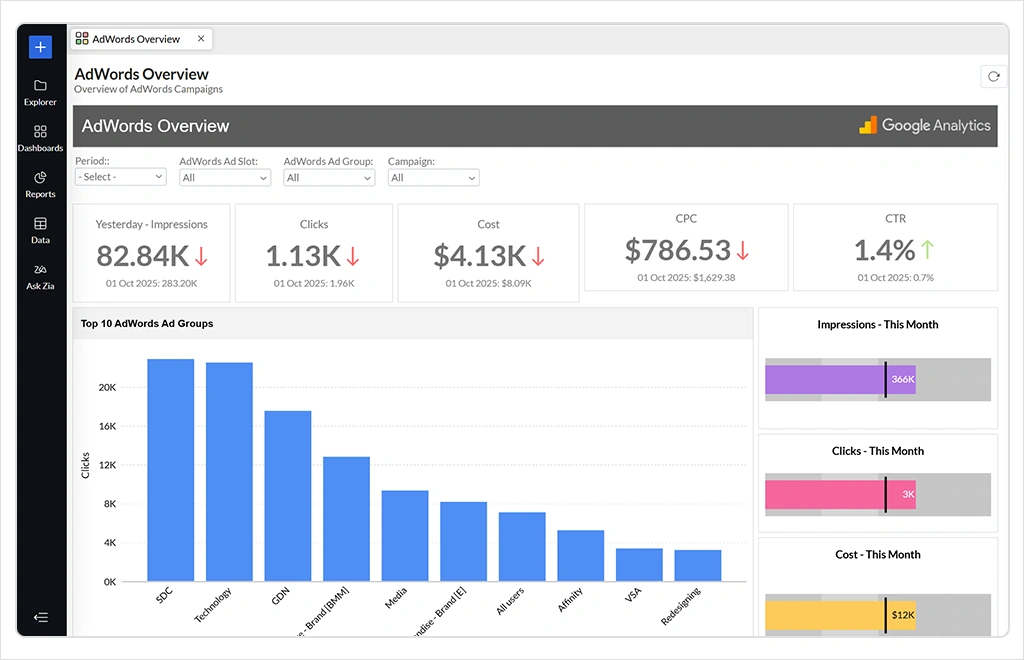
Zoho Analytics is part of the larger Zoho business suite and offers a solid mix of reporting, visual analytics, and dashboarding. It’s designed for teams that want flexibility without heavy setup. For startups already using Zoho tools or looking for a budget-friendly BI platform, it’s a capable option among BI tools for startups.
Strengths
Limitations
What Makes It Stand Out
Best For:
Zoho Analytics is a good fit for startups that are already using Zoho products or want a flexible, affordable entry into structured BI. It’s ideal for teams that want traditional dashboarding with AI support, but don’t need full collaboration or embedded workflows.
Pricing
Free plan available. Paid plans start from $24/month.
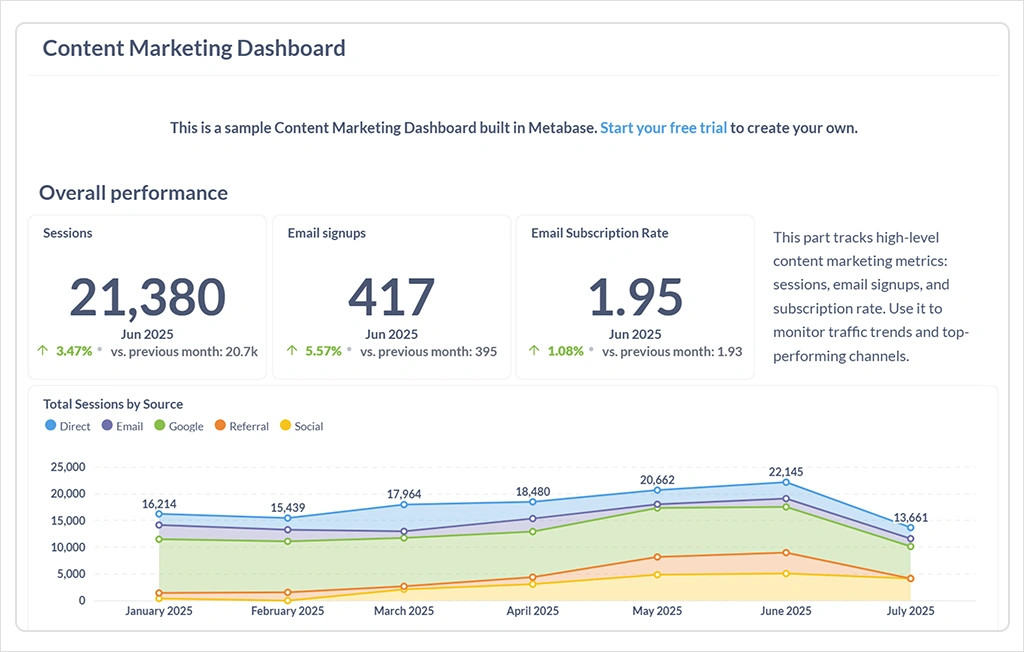
Metabase is an open-source business intelligence tool that prioritizes accessibility and speed. It’s especially popular with startups that want control, transparency, and minimal licensing costs. While it’s simple on the surface, it also offers SQL support for deeper analysis. For early teams that need flexibility, it’s one of the most appealing BI tools for startups.
Strengths
Limitations
What Makes It Stand Out
Best For:
Metabase is ideal for startups with basic analytics needs and some in-house technical ability. It’s especially useful when budget matters and control are a priority. A strong fit for data teams that want transparency and speed without overcomplicating their stack.
Pricing
Free open-source version. Pro plan starts around $85/month for cloud-hosted features.
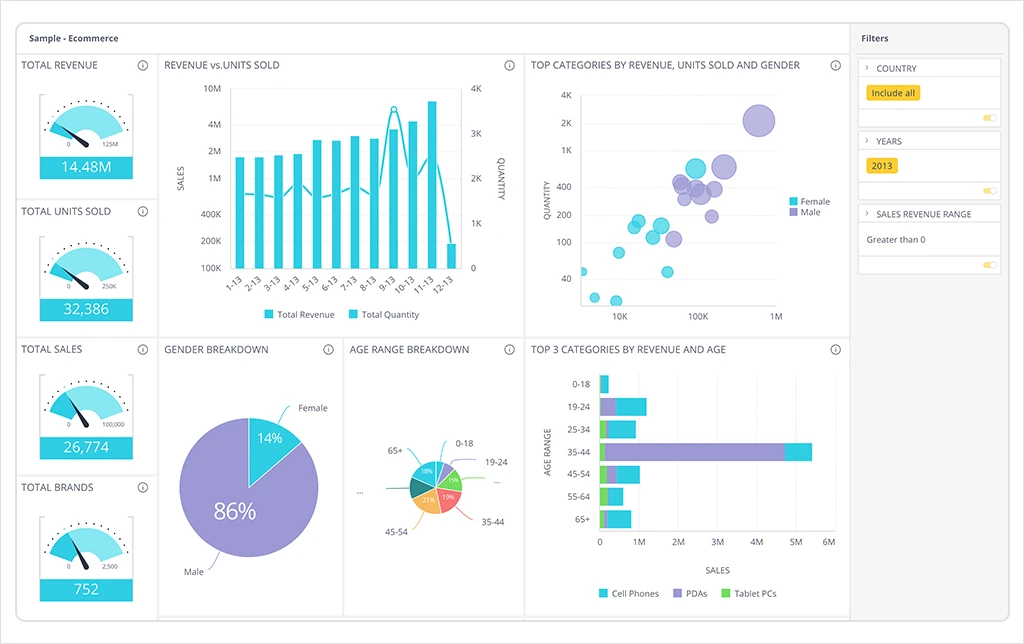
Sisense is a powerful, developer-focused platform built for embedding analytics and working with complex data environments. It offers full white-labeling and advanced customization, making it a favorite for B2B SaaS products that want analytics deeply integrated into their app. But for early-stage teams, it may be overkill. Among business intelligence tools for startups, it’s more suited to those building analytics into their own software.
Strengths
Limitations
What Makes It Stand Out
Best For:
Sisense is best for product-driven startups that want to offer analytics to their customers inside their own app. It’s not built for internal dashboards or team collaboration, but it’s one of the strongest options for embedded analytics at scale.
Pricing
Custom enterprise pricing. Requires direct contact for a quote.
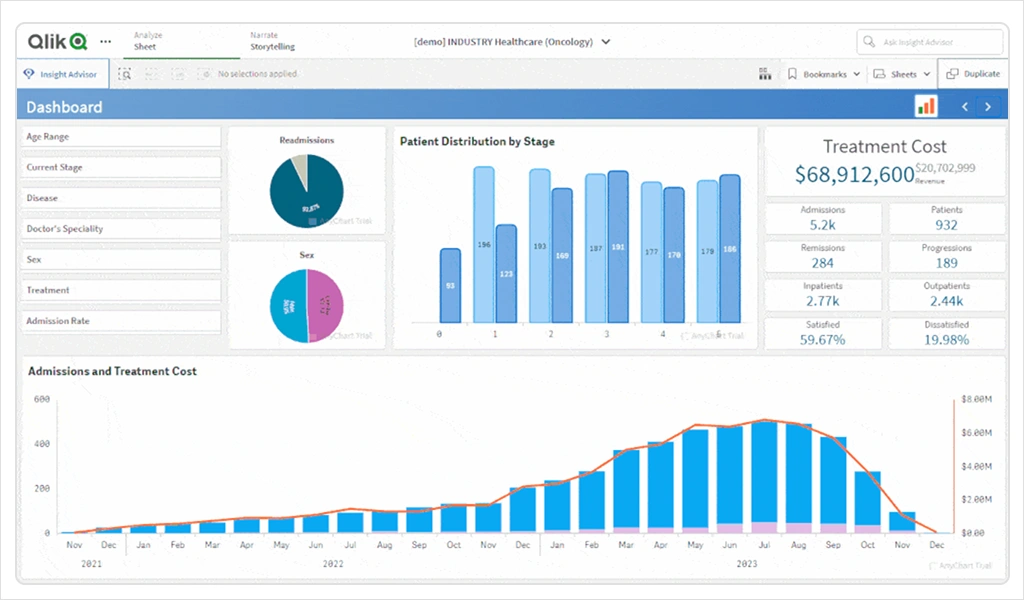
Qlik Sense is a data analytics platform known for its unique associative engine, which enables users to explore data without being limited by pre-defined query paths. It’s designed for speed and flexibility and is widely used in enterprise environments. For startups with technical resources, it offers power, but it comes with a learning curve that may slow adoption. It’s one of the more complex BI tools for startups, but also one of the most scalable.
Strengths
Limitations
What Makes It Stand Out
Best For:
Qlik Sense is a good fit for data-driven startups with engineering support and complex reporting needs. If your team needs more than dashboards and can invest in setup, it delivers strong performance and scalability.
Pricing
Free trial available. Paid plans are per-user or capacity-based, with enterprise pricing.
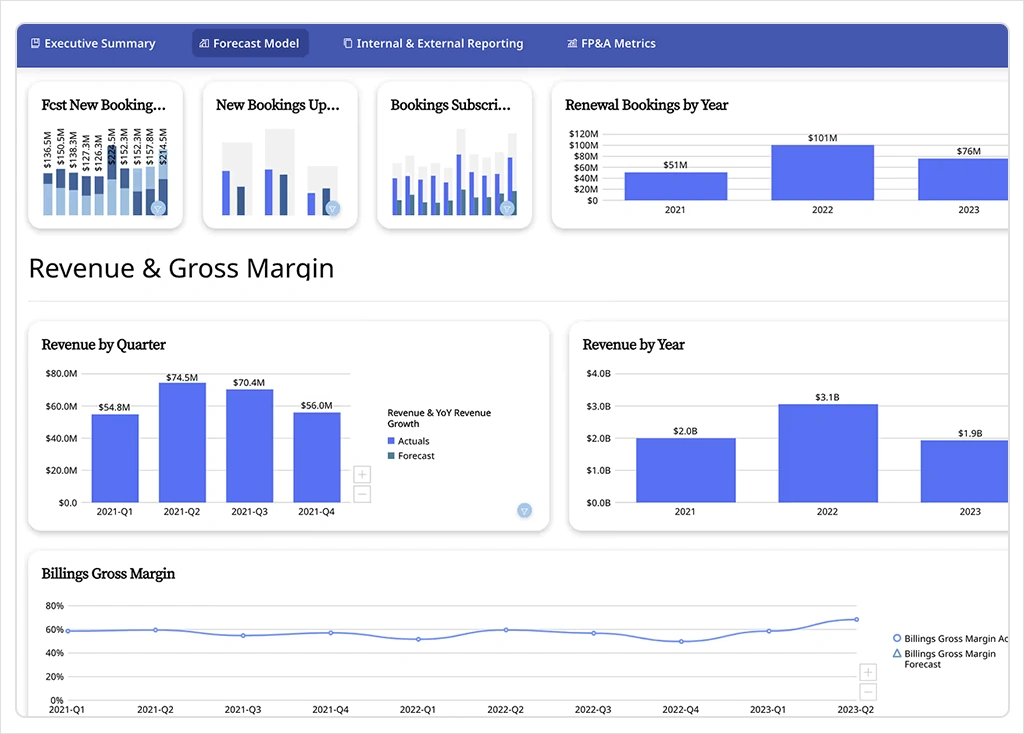
Domo is an enterprise-grade business intelligence platform that combines dashboards, data pipelines, and workflow automation into one cloud-based interface. It’s built to support full organizational visibility, and while that’s powerful, it may feel heavy for small startups. Among BI tools for startups, Domo makes sense for teams that already handle large data volumes and want everything — visuals, alerts, and actions — in one place.
Strengths
Limitations
What Makes It Stand Out
Best For:
Domo is best for later-stage startups or fast-growing teams already drowning in data. If you need a powerful system to unify data, automate actions, and manage operations from one place, and you’re ready for the learning curve, it delivers enterprise-grade value.
Pricing
Custom, usage-based pricing. Free trial available.
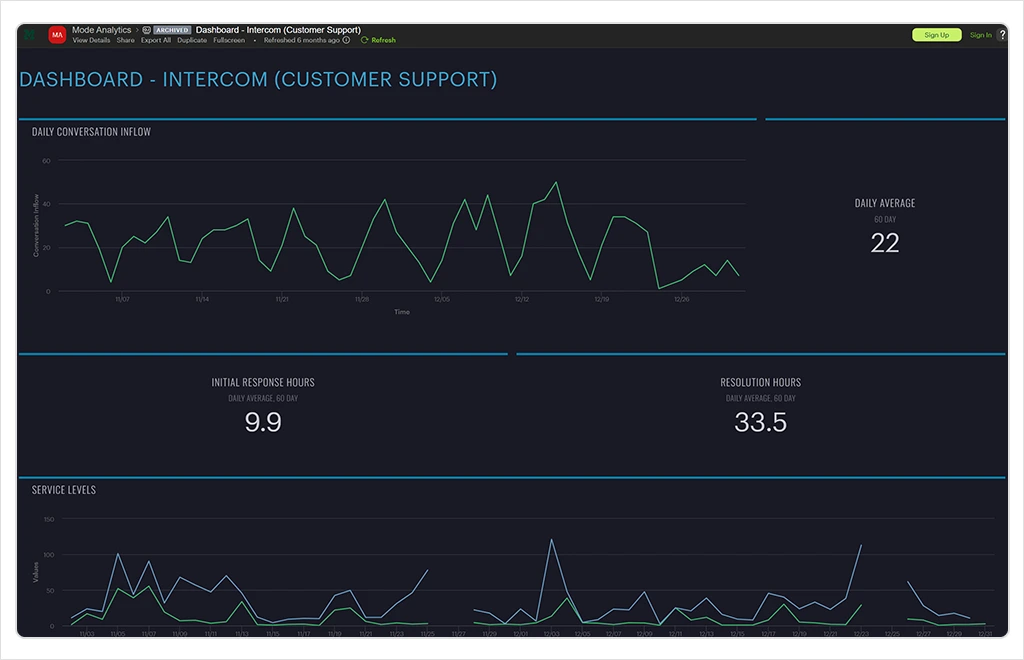
Mode is a modern BI platform tailored for data analysts and technical teams. It combines SQL, Python, and R with visual dashboards and notebooks, allowing deeper, more customizable analysis. While it’s flexible and powerful, it’s technical, making it better suited for data-savvy startups than for general business users. Among business intelligence tools for startups, Mode stands out when analytics is already a core function.
Strengths
Limitations
What Makes It Stand Out
Best For:
Mode is best for startups with in-house data teams who want full control over how they work with data. If you prioritize reproducibility, advanced modeling, or custom reporting across multiple languages, Mode gives you the depth you need.
Pricing
Free plan available. Paid tiers (Pro and Enterprise) include collaboration, governance, and embedding features.
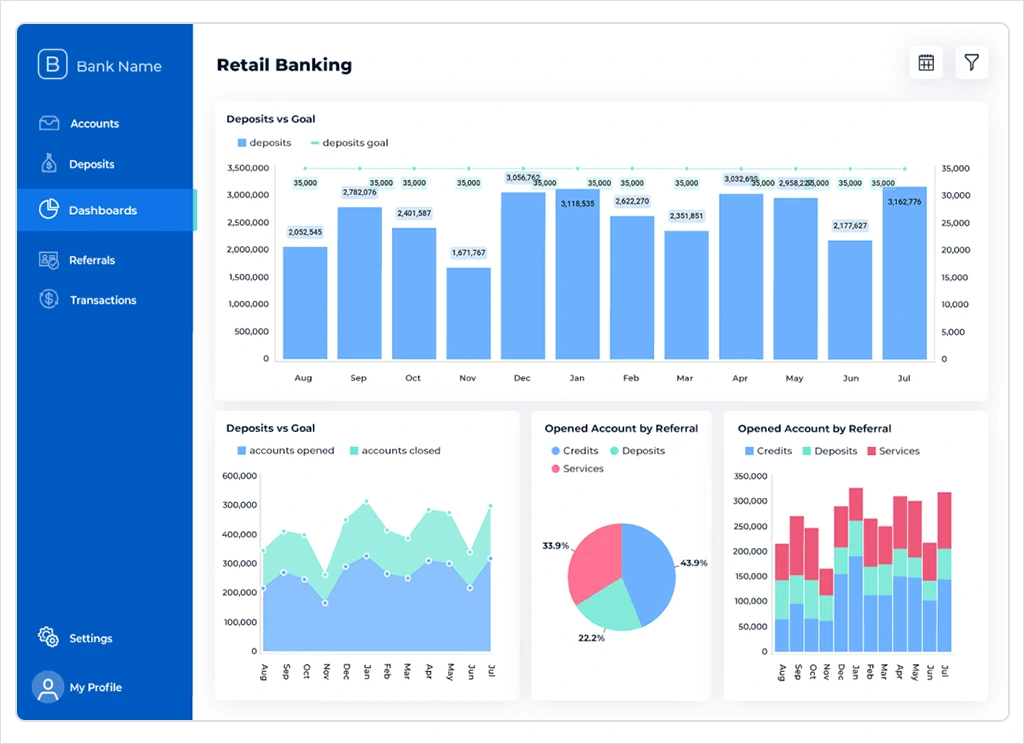
Reveal is a business intelligence tool for startups that want embedded analytics, not a standalone dashboard tool. It integrates natively into your app through SDKs, so customers get visual, interactive data without leaving your product. Built with SaaS teams in mind, Reveal gives you full control over the analytics experience, with scalable performance, flexible deployment, and predictable pricing.
Strengths
Limitations
What Makes It Stand Out
Best For:
Reveal is ideal for startups building SaaS platforms that need to deliver in-product analytics to end users. If you’re launching customer-facing dashboards and want to skip the overhead of building them yourself, Reveal offers speed, flexibility, and scale, all without compromising the user experience.
Pricing
Reveal offers fixed, transparent pricing that doesn’t change as you scale.
Choosing the right business intelligence platform isn’t just about features. It’s about speed, clarity, and how well the tool fits into how your startup actually works. Many platforms overpromise but leave teams stuck managing dashboards in one tool and acting in another. For most early-stage companies considering data analytics, the real value lies in simplicity and speed to insight.
Most startups don’t need a massive BI stack. They need a system that answers questions quickly and helps teams stay aligned. Here’s what to focus on:
As tools evolve, so do expectations. It helps to know what’s coming next, especially if you want to future-proof your decision.
Business intelligence is changing fast. What used to be a reporting function is now part of daily decision-making. For startups, that shift is especially relevant. The next generation of BI isn’t just about dashboards. It’s about giving every team member the ability to ask questions and act immediately.
Here are the top trends reshaping data analytics for startups right now:
These shifts are already changing what startups expect from BI tools and setting the bar higher for every platform on the market.
The best business intelligence tools for startups are the ones that help you move faster with less effort. Whether you’re tracking performance, planning growth, or getting your team on the same page, a BI tool should remove friction rather than add another system to manage.
If you’re starting out, Looker Studio and Metabase offer quick wins. If you need complex enterprise features, Power BI and Tableau still lead in depth. For embedded dashboards inside a product, Reveal is purpose-built.
But if you’re looking for a platform that connects insights to execution, Slingshot is worth a closer look:
Slingshot:
The tools are improving quickly. Choosing one that fits your team early means spending less time patching systems together and more time building your business.
SHARE THIS POST