
How Stephen Gould Scaled Its Capacity by 30% without Making a Single Hire

Data, data, data. It's taking over, and for good reason. Knowing and using data analytics and data science is now easy and it doesn't require much of a training anymore. How? Read on to find out.
Executive Summary:
Data, data, data. It's taking over, and for good reason. Knowing and using data analytics and data science is now easy and it doesn't require much of a training anymore. How? Read on to find out.
When businesses want to track their decisions with data and use facts to make their future decisions, they need to use Big Data. That, however, is not an easy feat if they don’t turn to Data Analytics vs. Data Science. Both disciplines help you tackle the decisions you need to make with the best possible approach – but how do you understand and use them without being a data scientist?
Data analytics is the science of extracting facts from data and drawing conclusions out of those facts. The term involves all the processes, tools, and techniques, including the storage and organization of data. Data analytics can help businesses improve their overall performance, achieve better customer satisfaction, lead better marketing campaigns and personalize their content. It unlocks the power of raw data by making it ready for human consumption.
For any enterprise, data analytics holds great importance in the search for the latest trends to follow, the potential blockers to look out for, and the problems that need solving. When used in a proper way and with a good tool, data analytics:
Data analytics improves business results through a range of techniques like:
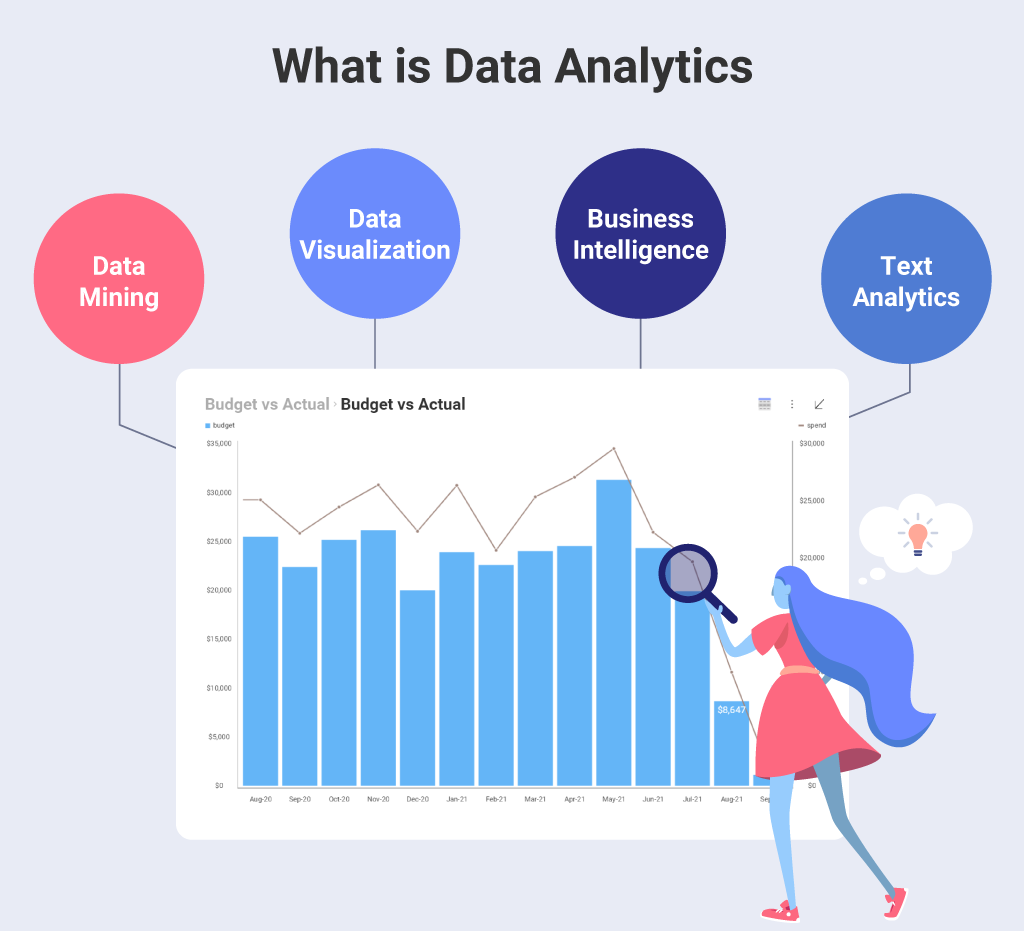
Ultimately, any organization can change its narrative for the better through data analytics – personalize strategy and content, develop better products, and boost performance.
Data analytics is of essential help to any company that wants to grab a competitive advantage and go beyond expectations. Here are some areas where data analytics can really help you transform and excel.
When you seize the right insights from the get-go, you can predict the future outcomes in such a way that help you build a product with a good understanding of the market, of the buying scenario, and the targeted customer – so you can match it to their needs.
Everybody knows that successful marketing campaigns are customer-oriented ones. Using data analytics, you can choose your form and direction of advertising smartly and more effectively, to impact the audience better and have them react the way you want them to.
Data analytics helps companies recognize potential problems as well as areas for improvement. It also shows a clear-cut picture of new trends and opportunities – all you need to do is follow the data.
A good data analytics tool can help you determine where costs need to be cut, what unnecessary investments to cancel, and target your efforts in marketing and sales in such a way that you bring forth new value and reduced costs for your business.
Data analytics can help any management learn fast where to push and where to pull their energy, to avoid mistakes and loss occurrences, as well as team desynchronization.
Data science is a multidimensional approach for obtaining actionable insights from big volumes of data, preparing them for analysis, and processing them – including performing data analysis on them. Data science reveals patterns in the data that can then be presented with the help of data visualization tools to the people who make the decisions in an organization.
Data science aggregates data insights with the use of:
The full lifecycle (or a pipeline) of data science includes several processes, the most important of which are:
This is the process of gathering raw data in real-time from all relevant sources via various methods.
The process of putting raw gathered data into an appropriate format to be analyzed and put through machine learning, deep learning, or other methods of analysis.
Examination of patterns, models, ranges, biases, and other metrics in the data, that show how to use it with predictive analysis and get useful insights.
Probably the most important step of the lifecycle – this is where analysis happens and the important facts are extracted from the data to be used later.
Presenting what is found through data visualization with reports, charts and more, to make more impact on the decision-makers who will go over them.
All the processes incorporated in data science strive to get to the data, process it, and ultimately translate it into business value.
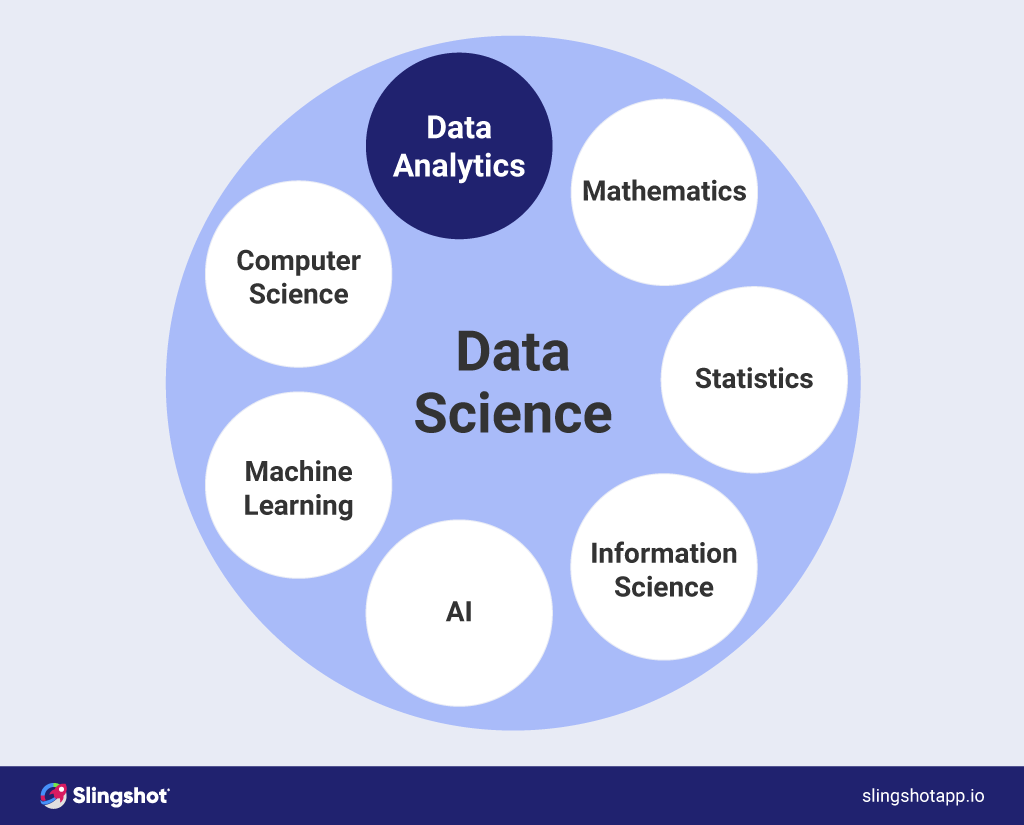
Data science consolidates and uses data in a way that helps businesses gain a competitive advantage and create a data-driven culture in a team. For an organization, data science can mean increasing product sales, having stronger marketing campaigns, better performance of everyone on the team in different departments and even preventing cyber-attacks and increasing security in IT systems.
In the day-to-day operations of any company, large and small, data science is important because it delivers:
Data science enables you to make better strategical decisions through informed analysis of customer behavior, trends in the market, and competition analysis.
Understanding trends brings smart decisions for project planning and management, distribution of tasks, and analyzing team performance.
The most vital thing for any business is understanding the market and customer needs, so they can give it to them. Data science provides those much-needed insights that help bring in more customers/users and ultimately revenue.
Тhere is a good chance that you can come across the terms Data Science and Data Analytics being used interchangeably. Тhere is however a difference between the two. While both deal with big data, essentially Data Science is the umbrella that includes Data Analytics in itself. Data Analytics is one of the component disciplines of Data Science, along with Mathematics, Statistics, Information Science, AI, Machine Learning, and Computer Science.
Аnother important difference is that while Data Science aims to find meaningful correlations in big datasets, while Data Analytics’s mission is to uncover the specifics of extracted insights.
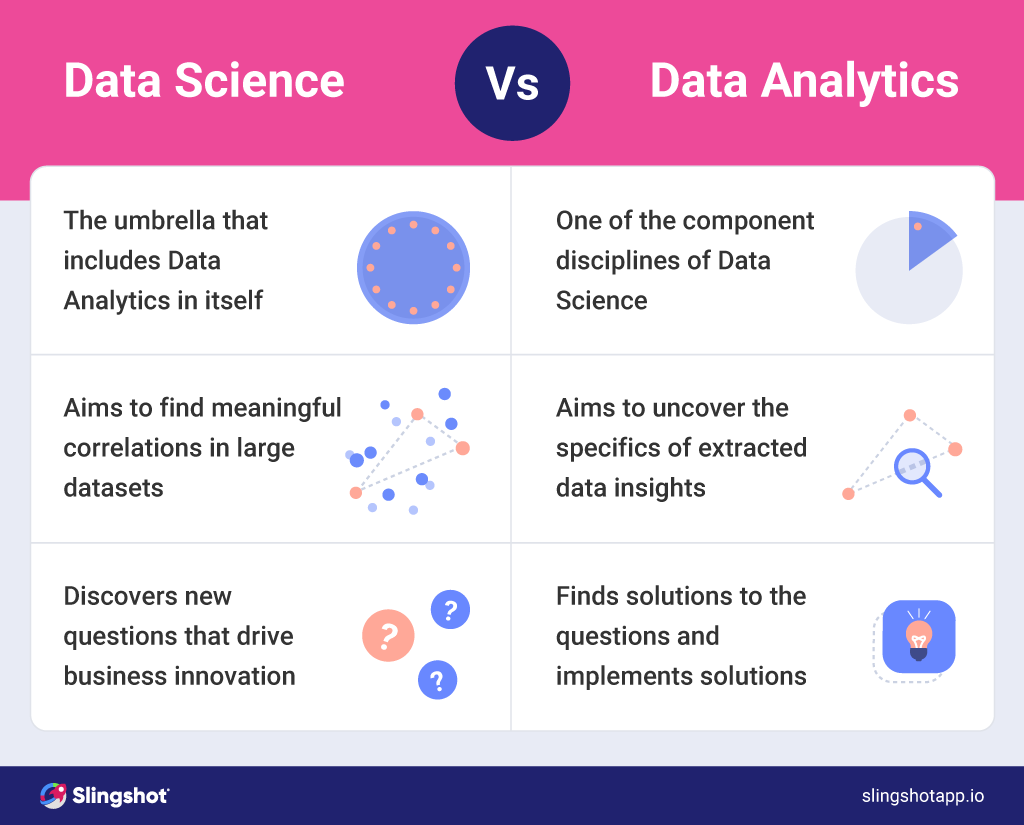
Both approaches deal with methods for data utilization and visualization, bringing complex insights into businesses who want to use a data-driven approach in their work. Through them, businesses gain actionable insights are able to stay on top of the latest trends.
So let’s take a look at how Data Analytics and Data Science are both used in business. They focus on the insights we extract from data, but they deal with different aspects of the organizational strategy.
Through both disciplines, most companies get to know their customers in more depth and personalize their strategies and products accordingly. That boosts a company’s overall performance. In business, Data Analytics and Data Science help with the following questions:
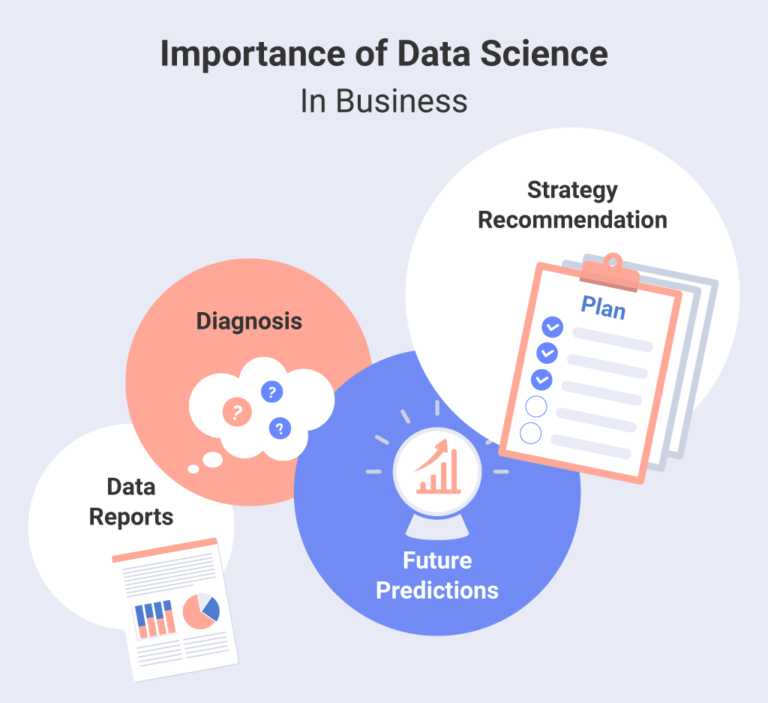
Here are some of the main things Data Analytics and Data Science are used in a business.
They reveal details about your customers like habits, demographic characteristics, aspirations, likes, and dislikes, etc. With aggregated data, you receive the opportunity to draw meaningful conclusions from reliable facts and metrics.
With data, you get ten steps ahead in customer expectations and bring more accurate and spot-on strategies in ongoing marketing and sales campaigns.
Data gives insights into potential problems areas and businesses have the opportunity to address dangers before they become major issues. Incorporating data science removes obstacles efficiently and fast.
Depending on the tools we use to gather and interpret data, businesses can match their goals faster. Extracting the right and most valuable facts and having them visualized, shared, and matched to the organizational purposes is truly invaluable.
With tools that help you view and interpret data in real-time, the decision-making process is flexible, fast and helps both the team and the managers stay smart in their strategy and move forward with ease.
There are five steps to utilizing a Data Science/Data Analytics workflow in the daily structure of your business.
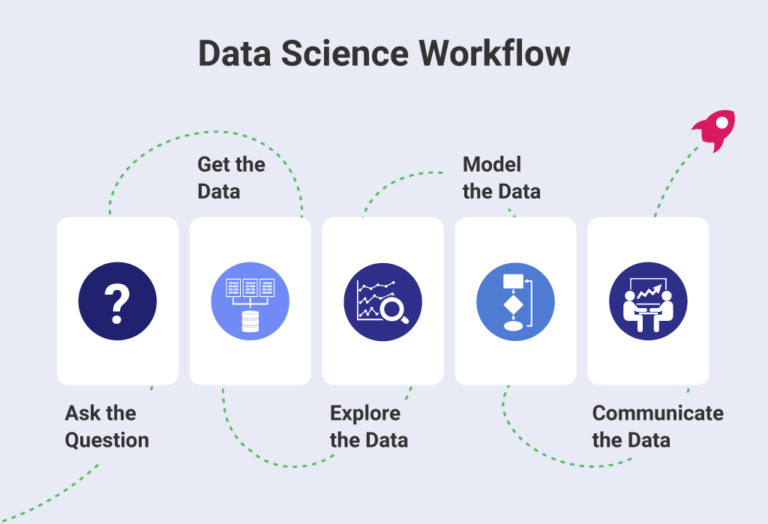
To find the right data, you need to ask the right question and then extract the answer from the data insights you will receive.
Gathering the data with the right tools and capturing its essence is the next step in the process.
Data exploration is the next step in the process – becoming acquainted and classifying the insights you’ve just gathered.
Data can be built, modeled, measured and validated, before being ready to be presented.
Communicating and sharing the data by visualizing the results and having feedback on it is probably the most important step in this process since it helps provide actionable insight on what to do next.
To achieve a good workflow and be more data-driven with just a few clicks, you need a tool incorporating good data analytics features.
Slingshot is a tool that aggregates data analytics, project and information management, chat, and goals-based strategy benchmarking – all in one, intuitive app. Thanks to the full business intelligence engine inside it, you can quickly connect to your different data sources and create dashboards within minutes.
As a tool for data analytics, Slingshot creates a perfect workflow by creating different types of dashboards. It’s easier than ever because it happens with just a few clicks, with many options to edit, a huge load of chart types, filters, and options to save and share your dashboards with internal and external team members.
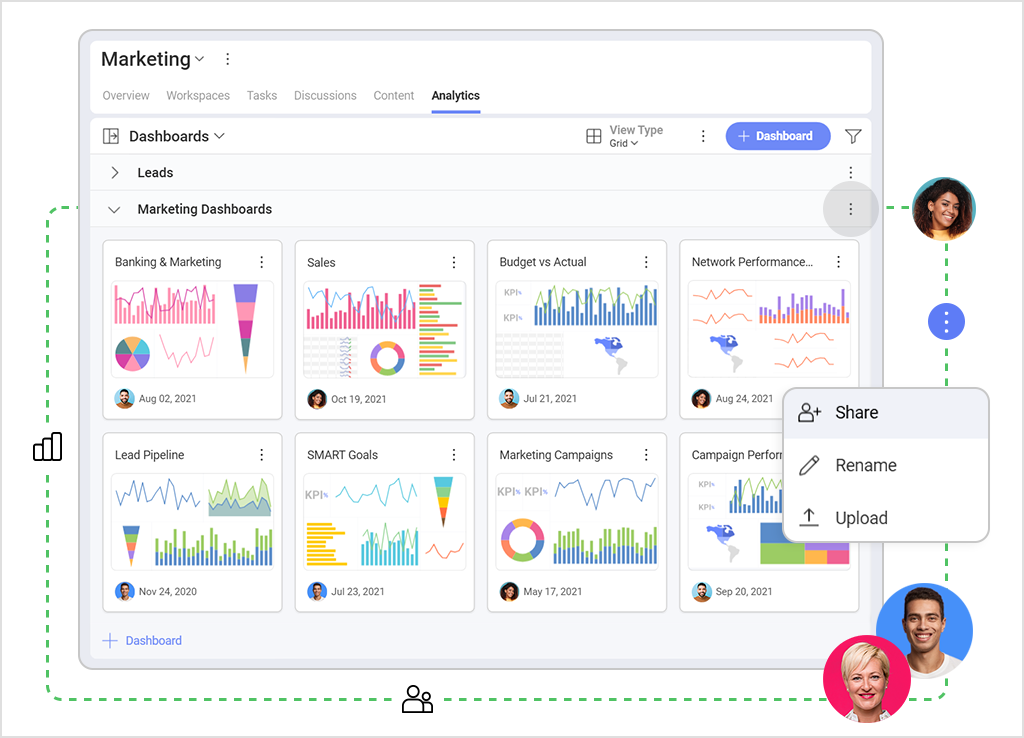
At its core, Slingshot is centered around data-driven characteristics that help teams stay on top of current data for campaigns, through dashboards, KPI tracking, and KPI indicator spreadsheets that are converted into data analytics which are then easily shared. It also offers a set of statistical functions that allow you to receive more insights from your visualizations.
Slingshot is simultaneously a business intelligence tool that provides you with dashboards and analytics, a chat platform for easy collaboration, a project management software, and a planning tool for the team, helping with ownership, division of tasks, and keeping tabs on progress and/or issues. Interested in learning more?
SHARE THIS POST